


Xdebug helper development background
Xdebug helperc: The official version of the php debugging plug-in is a PHP that works together with Zend Studio and WAMPSERVER Chrome debugging plug-in. I use xdebug when doing PHP development, but since I installed xdebug, I found that every time I debug, I need to start from the beginning in eclipse, and then walk step by step to the page you want to debug, instead of debugging whenever I want. When I used zenddebugger before, I could start debugging on any page and notify the development environment directly from the browser that debugging was needed. Instead of starting debugging from the development environment first. Debugging can be performed whenever debugging is needed. At this time, you need a chrome browser with a plug-in called xdebug helper. This extension is very useful for PHP developers who use PHP tools with Xdebug support like PHPStorm, Eclipse with PDT, Netbeans and MacGDBp or any other Xdebug compatibility analysis tool like KCacheGrind, WinCacheGrind or Webgrind. By default, the extension icon will appear on all pages, but to keep your browser as clean as possible, you can configure the extension to only display the pages you want in the settings panel.
Xdebug helper installation method
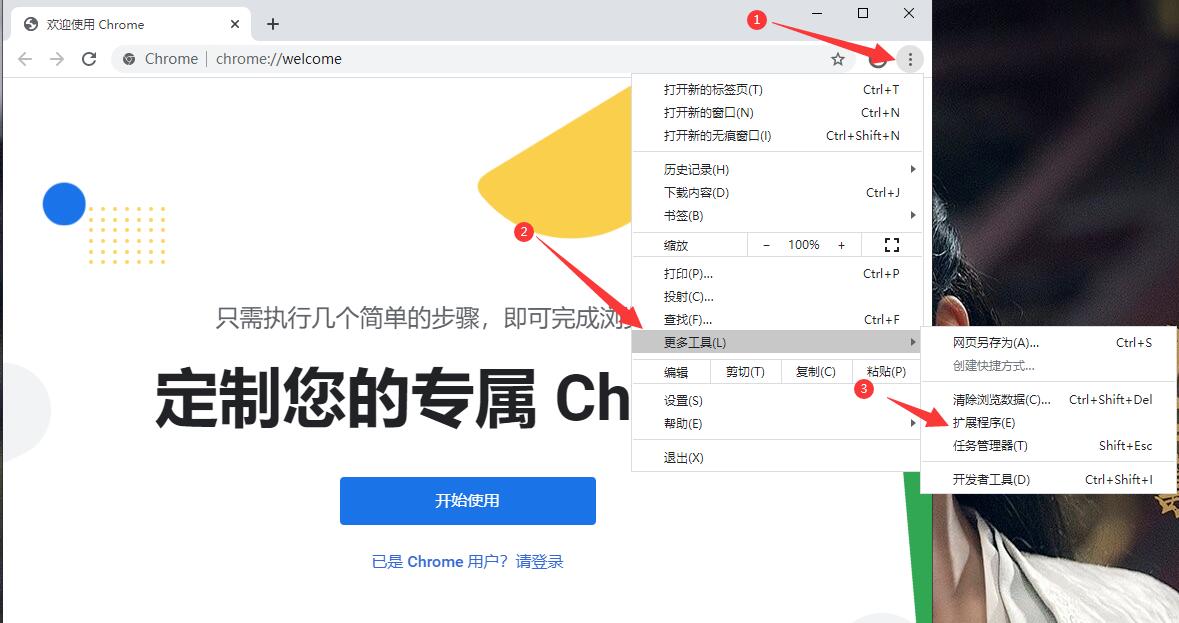
1. First, the user clicks the Customize and Control button in the upper right corner of the browser, selects more tool options in the drop-down box, and then clicks on the extension to enter the Chrome browser's extension manager page.
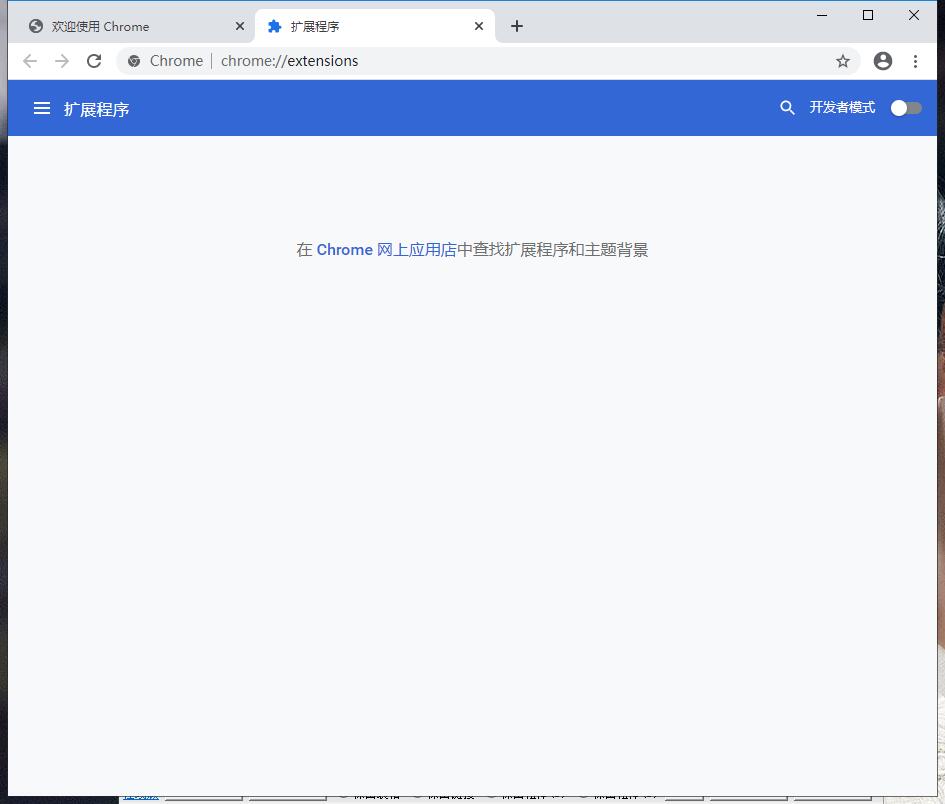
2. In the extension manager of the opened Google Chrome, the user can see some installed Chrome plug-ins, or there is no Chrome plug-in at all.
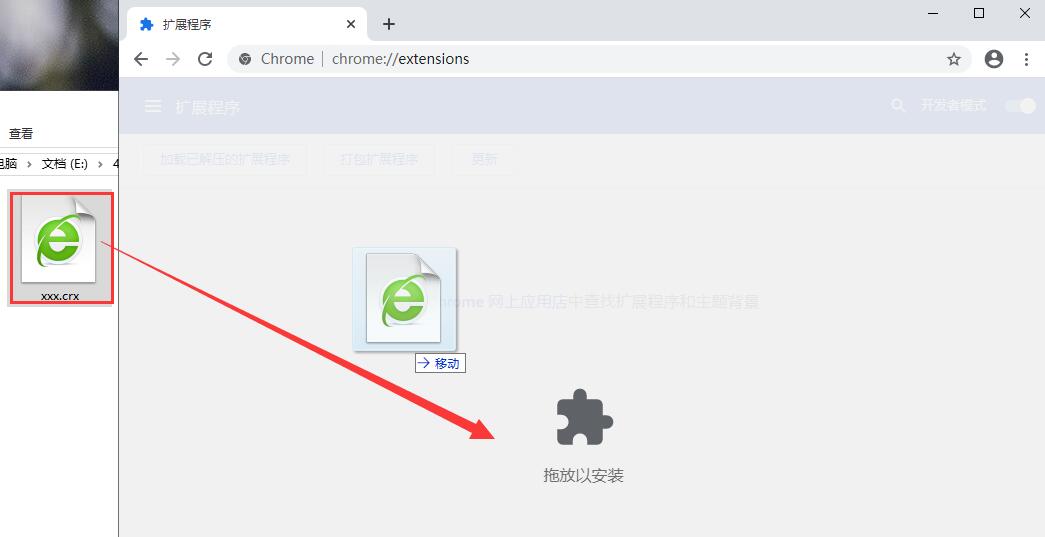
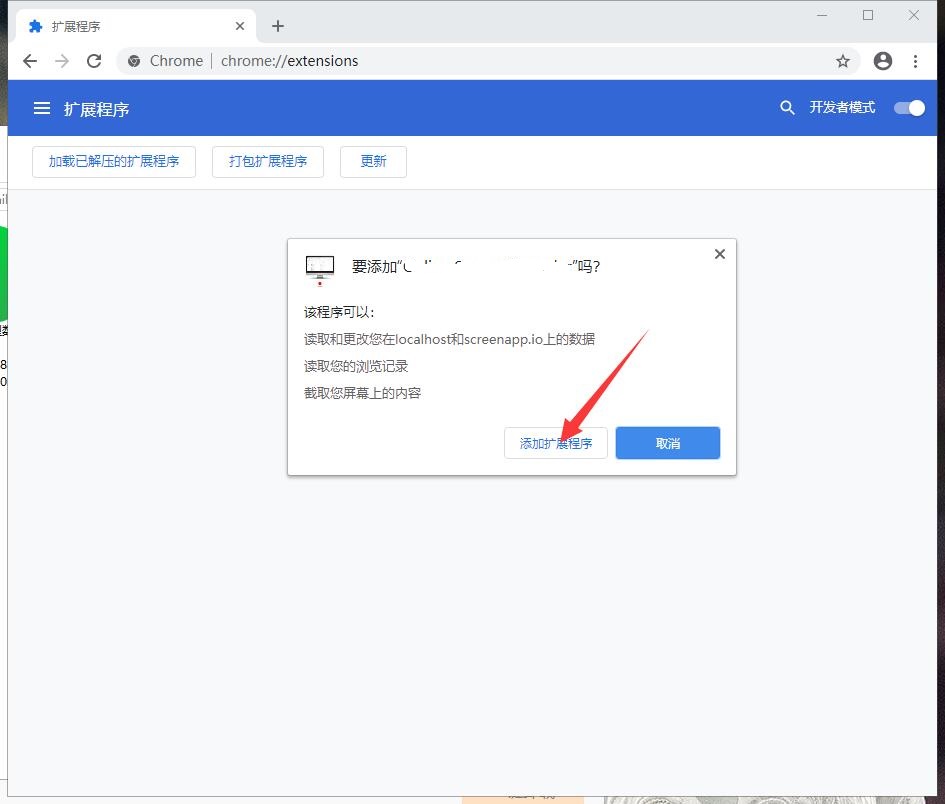
3. Find the Chrome offline installation file xxx.crx that you have downloaded, and then drag it from the resource manager to Chrome's extension management interface. At this time, the browser will prompt you to "Add xxx"? We click "Add Extension" to successfully install the plug-in.
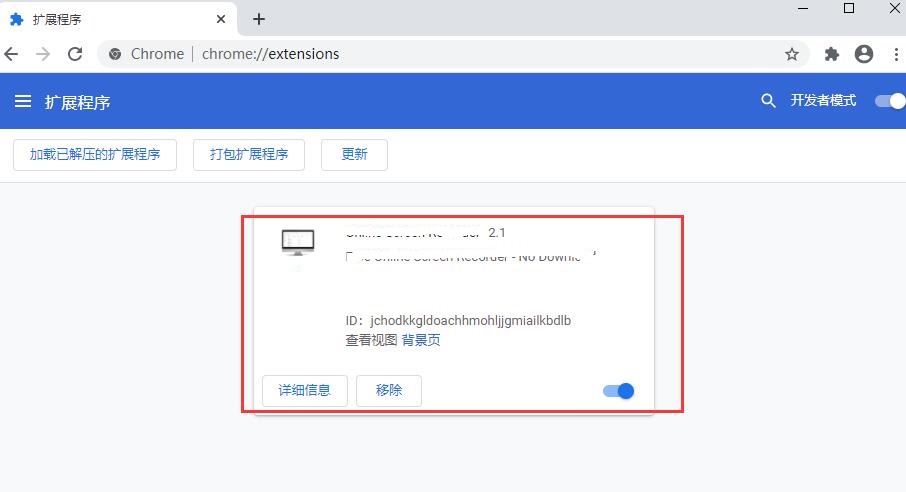
4. It shows that the plug-in has been successfully installed. Click "Remove" to uninstall, which is quite simple.
Xdebug helper usage instructions
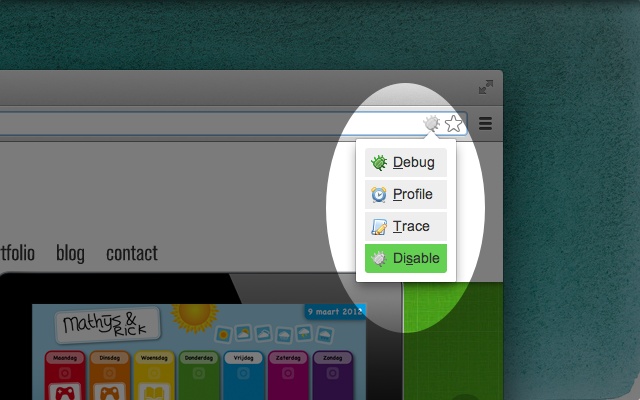
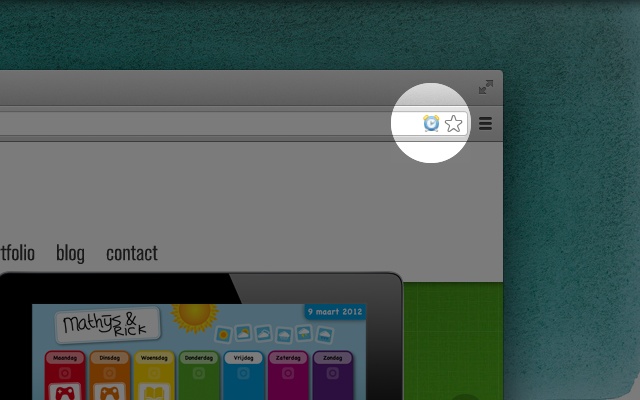
1. After installing xdebug helper, you can see a small crawler on the right side of the browser address bar. Click it as shown below:

2. Select Debug, and your development environment will be notified that the next code needs to be debugged. Select disable, and it will run directly. As shown below:
3. Configure it in xdebug helper, select phpstorm and fill in PHPSTORM in the box on the right.
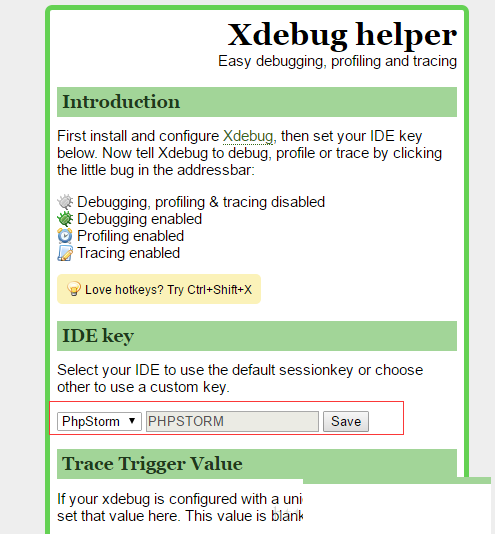
4. All configurations have been completed here. You can set breakpoints in phpstorm and then use the browser's xdebug helper to enable page debugging.
5.xdebug helper commonly used hotkeys:
- Ctrl + Shift + X (Cmd + Shift + X on Mac) opens a pop-up window.
-Alt + Shift + X switches debugging state.
Xdebug helper update log
1. The pace of optimization never stops!
2. More little surprises are waiting for you to discover~
Huajun editor recommends:
Xdebug helper is so easy to use. It is one of the best software among network assistants. I believe friends who have used it will say it is easy to use. If you don’t like it, we still have it.Number cube,Desktop Taobao,Zhongyuan Bank Online Banking Assistant,Sogou input method skin box,Mung Bean HTC one-click unlock


Useful
Useful
Useful