


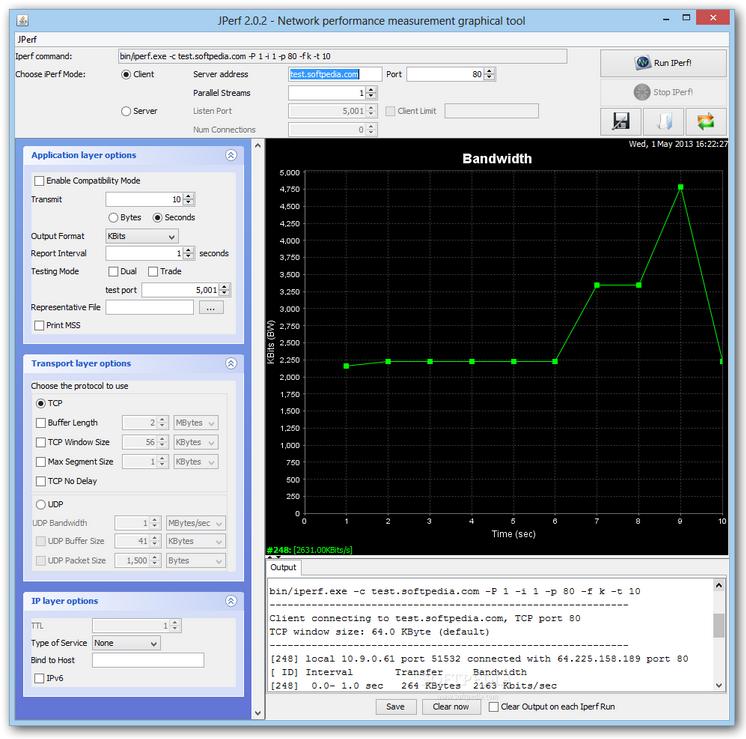
JPERF software features
1. Support TCP window value buffering through socket.
2. When P thread or Win32 thread is available, multi-threading is supported, and the client and server support multiple connections at the same time.
3. TCP measures network bandwidth.
4. Report the size and observed value of MSS/MTU value.
JPERF software features
1. TCP
1. Measure network bandwidth.
2. Report the size and observed value of MSS/MTU value.
3. Support TCP window value buffering through socket.
4. When P thread or Win32 thread is available, multi-threading is supported. The client and server support multiple simultaneous connections.
2. UDP
1. The client can create a UDP stream with a specified bandwidth.
2. Measure packet loss.
3. Measurement delay.
4. Support multicast.
5. When P thread is available, multi-threading is supported. The client and server support simultaneous multiple connections (Windows is not supported).
3. Other functions
1. Where appropriate, K (kilo-) and M (mega-) can be used in the options. For example, 131072 bytes can be replaced by 128K.
2. You can specify the total running time and even set the total amount of data to be transmitted.
3. In reports, choose the most appropriate units for the data.
4. The server supports multiple connections instead of waiting for a single-threaded test.
5. Repeatedly display network bandwidth, fluctuations and packet loss at specified time intervals.
6. The server can run as a background program.
7. The server can run as a Windows service.
8. Use typical data flows to test the impact of link layer compression on available bandwidth.
9. Supports the transmission of specified files, and can conduct qualitative and quantitative testing.
JPERF usage instructions
1. The running of Jperf windows version requires Java runtime environment (Java SE Runtime Environment) support, if it is not installed, you need to install it first, and then run "jperf.bat".
2. Two components must be installed to use JPerf: JPerf server (used to monitor incoming test requests) and JPerf client (used to initiate test sessions).
JPERF parameter description
1. Parameter description
-s starts in server mode, eg: iperf -s
-c host starts in client mode, host is the server address, eg: iperf -c 222.35.11.23
2. General parameters
-f [k|m|K|M] means to display the report in Kbits, Mbits, KBytes, MBytes respectively. The default unit is Mbits, eg: iperf -c 222.35.11.23-fK
-i sec displays the reporting interval in seconds, eg: iperf -c 222.35.11.23 -i 2
-l buffer size, default is 8KB, eg: iperf -c 222.35.11.23 -l 16
-m displays the maximum mtu value of tcp
-o Output the report and error information to the file eg:iperf -c 222.35.11.23 -o c:iperflog.txt
-p specifies the port used by the server or the port connected by the client eg: iperf -s -p 9999; iperf -c 222.35.11.23 -p 9999
-u Use udp protocol
-w specifies the TCP window size, the default is 8KB
-B binds a host address or interface (use this parameter when the host has multiple addresses or interfaces)
-C is compatible with old versions (used when the server and client versions are different)
-M sets the maximum mtu value of TCP packets
-N Set TCP no delay
-V transmits ipv6 data packets
3. Server-specific parameters
-D runs ipserf in service mode, eg: iperf -s -D
-R stops the iperf service, for -D, eg: iperf -s -R
JPERF update log
1. The details are more outstanding!
2.BUG gone without a trace
Huajun editor recommends:
JPERF can help you solve many problems. I believe that as long as you dare to use it, you will definitely fall in love with it and recommend it to you.Webcam search tool,TrafficMonitor (computer network speed monitoring floating window),FPort,FreePortScanner,MRTG


Useful
Useful
Useful