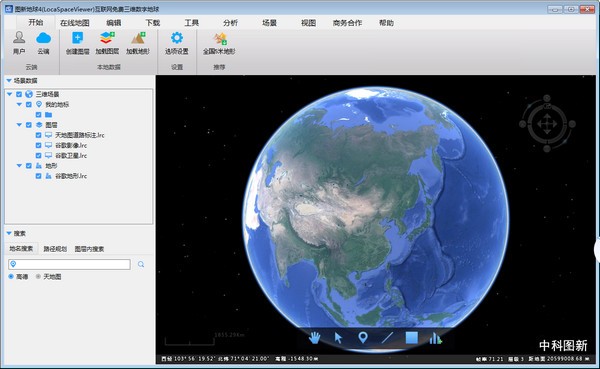
Picture new earthSoftware features
Flight browsing mode: Today's leading flight browsing technology in 3D GIS technology supports flight browsing and multi-perspective browsing of 3D scenes. Users can easily control and modify browsing routes and flight speeds.
Terrain exaggeration: Conveniently enlarge or reduce the terrain undulation effect of terrain data by different multiples.
Customized extraction of elevation points: Customize the sampling spacing and number of sampling points to extract elevation points.
Customized extraction of contours: You can directly customize the point density and contour spacing on the ball to extract contours, or you can extract contours based on your own elevation data.
Cloud data: After users log in to their account, they can draw point, line, and surface data and upload it to the cloud simultaneously. Both the PC and Android terminals can be synchronized from the cloud to the local computer to realize cloud storage and cloud sharing of data.
Online data publishing service: LocaSpace Viewer (LSV) provides supporting online data publishing services, which can realize Internet publishing services for massive data. There is a function to connect to the server. Through this function, you can directly connect to the remote server through the network address, thereby realizing a copy of data shared by multiple clients.
Photo generation route function: Generate a trajectory based on the photos taken during the trip, and display the travel route directly on the map.
GPS file format conversion: GPS files in almost various formats can be converted into the universal kml format. Different GPS devices and different manufacturers generate different GPS data formats, which brings a lot of trouble to the universal use of data. Here, the commonly used GPS data format can be converted into the more universal kml format. Supported formats include *.gpx, *.gdb, *.trl, *.csv, *.loc, *.wpt, *.plt, *.pcx, *.log, *.loc, etc.
Exhibition point: You can convert the coordinate file in txt format into kml for display, and convert the text content of the latitude and longitude coordinates (Longitude, Latitude, Elevation, name format) into kml.
Three-dimensional effects: You can add various particle system demonstration effects, fountains, flames, water effects, etc. on LocaSpace Viewer (LSV).
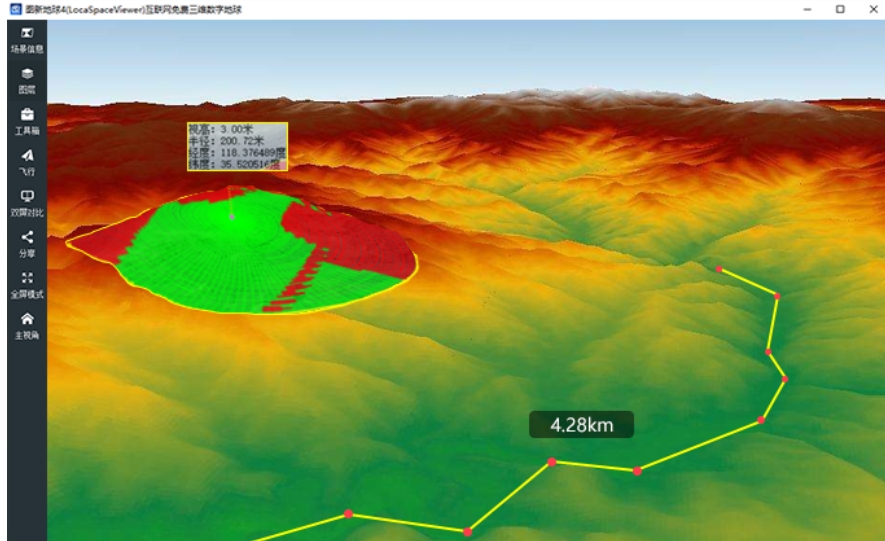
Picture new earthFAQ
1 Basics
1.1 What data does LSV support loading?
LSV supports loading raster, vector, model and other data. Mainly includes:
Raster types: tif, lrp, img, dem, adf, idr, grd, hdr, lrc, etc.;
Vector types: kml, kmz, shp, dxf, dwg, lgd, ldb, tab, mif, vec, etc.;
Terrain type: tif, img, grd, asc, lrp, raw, lrc, dem, adf, idr, sid, hgt, etc.
Laser point cloud:las
Artificial models: 3ds, obj, gcm, etc.
Real-life model: osgb
Generally, the data supported by LSV can be dragged and dropped to the main interface of the LSV software for loading.
1.2 What are the shortcut operations for LSV?
LSV has many convenient shortcut operations, mainly mouse operations and shortcut key operations.
Mouse operation: press the scroll wheel or right-click and drag the mouse to adjust the three-dimensional perspective
Shortcut key operations:
Map area:
Alt+1: draw points
Alt+2: Draw a line
Alt+3: Draw the surface
Alt+4: Select object
WASD/↑↓←→: Pan the map
Left column:
Ctrl+X: Cut selected elements
Ctrl+V: Paste selected elements
Ctrl+C: Copy selected elements
F2: Rename selected elements
Del: Delete features/remove layers
Drawing process:
Ctrl+Z: Undo the previous node
1.3 Why can’t I see the annotation after loading SHP into LSV?
Sometimes after loading the SHP file, no name is displayed, making it difficult to find the corresponding element. This is mainly because the elements of the SHP file itself have no names, but the general elements of SHP have attribute tables corresponding to them. Therefore, in LSV, you can set the attribute table field to be displayed as the name of the feature.
Setting method: Find the SHP layer in the left column, right-click, open the attribute table, select the label name, set the name of the column to be displayed, click OK, exit the attribute table, and now you have it.
But you may still not see the effect. At this time, in the LSV main interface, find Options Settings>Label Settings>Maximum Visible Distance, increase the corresponding number, and you can see the SHP annotation. This modification only needs to be modified once.
1.4 How to load CAD in LSV?
If the CAD data is in the standard coordinate system, that is, the ellipsoid reference information and projection information are clearly known, then you can directly drag the CAD into LSV, configure the corresponding information, and then the CAD can be successfully loaded.
What if you don’t know the basic information of CAD? You can test the corresponding information of CAD through rough guessing.
Older drawings are generally from Xi'an 80 or Beijing 54, while newer drawings may be from the national 2000 benchmark.
Then there are 3 possibilities for the benchmark, 54/80/2000.
Next, projection judgment: Based on the scale, you can roughly judge whether 3-degree or 6-degree zoning is used.
Gaussian projection generally has two situations, 3-degree or 6-degree zoning.
Then, calculate the Gaussian projection band number based on the LSV spherical coordinates (latitude and longitude) corresponding to the CAD drawing:

Then open the CAD drawing and look at the CAD coordinates to see if it contains the calculated band number.

At this point, the judgment of the CAD drawing is basically completed, and several possibilities have been combined:
Datum (80 54 2000) + Gaussian projection (3/6) + band sign (longitude calculation) + whether the CAD drawing coordinates have a band sign. There are several possibilities for getting the CAD drawing.
Then try the possibilities of these combinations, and you will have a higher probability of testing the information of the CAD drawing.
What if the CAD drawing is drawn in a relative coordinate system instead of an absolute coordinate system? Or what should I do if it really cannot be tested?
In this case, you can refer to the tutorial to handle it
1.5 Why can’t I see images on my LSV?
LSV loading images is generally relatively stable, if you encounter a situation where you cannot see the image.
General reference for inspection ideas:
Is the image layer loaded? If not, load the Google image layer;
Is the Google Image layer blocked by other layers? If there are other non-transparent layers on top of the Google Image layer, the Google Image layer may be blocked;
Whether the hosts have been modified, if so, restore the default hosts;
If it still doesn’t work, you can download the gadget, run it, and follow the tool tips to fix it.
2 Map images
2.1 What online maps does LSV support?
The online maps that come with LSV by default mainly include: Google Earth images, Google web map images, Google Earth historical images, sky map series, sky map province series, thematic map series, geological map series, etc.
In addition, you can create your own online map source to load customized online maps. For tutorials on making online image sources, please refer to: http://blog.locaspace.cn:81/?p=686
LSV mainly supports: TMS slicing service of WEB Mercator projection; TMS slicing service of direct projection of longitude and latitude, etc.
2.2 What data is LSV image download? What resolution? What projection coordinate system?
LSV image download, you can download Google images and Tiantu images. Among them, Google images are mainly the WorldViewer series of satellite data owned by DigitalGlobe. The maximum resolution of this series of satellite data is 0.31m, and the resolution in most areas is 0.5m. It is hard to say in uninhabited areas, it may be between 2.1m and more than 30.
In the LSV image download results, Google Image is the direct projection of longitude and latitude of the WGS84 benchmark, and Google Satellite is the WEB Mercator projection of the WGS84 benchmark.
Sky map images are mainly based on domestic data. Level 17 generally uses the data of Ziyuan No. 3. Above level 17, it is available in urban areas and comes from complex sources. It is not available in many mountainous areas.
The data resolution of Ziyuan No. 3 is 2.1m
2.3 Why is the resolution of images in some places very low?
This mainly depends on whether anyone has purchased satellite images in this place before, or whether Google has purchased the copyright to the satellite images here. If there has been no construction work in this place and no one has purchased satellite images, which means that there are no satellites to photograph this place and Google cannot buy the copyright, then the resolution and update frequency will be very low. LSV just calls Google's data.
The image sources used by Google Earth are complex. For large cities and major areas, DG satellites are used, with an original resolution of 0.3m. However, most of the resolutions provided by Google are 0.5m. That is, the resolution of Google Earth is generally only provided to 18 layers. The 19th floor is a digital amplification of the 18th floor. In China, most of them are below 18 floors. In uninhabited areas and mountainous areas, many places are level 15 to 17.
2.4 What is the difference between Google imagery and Google satellite in LSV?
Google Satellite 1: Image data of Google Maps (WEB version) CN server, fast access speed, stable, with Google watermark, WGS84, projection is WEB Mercator projection;
Google Satellite 2: Image data of Google Maps (WEB version) COM server, access speed is average, relatively stable, with Google watermark, WGS84, projection is WEB Mercator projection;
Google Image: Google Earth image data, supports Google historical images, access is restricted by the network, telecommunications networks will block the area from time to time, large downloads may have IP blocked, no watermark, WGS84, projection is latitude and longitude projection.
The downloaded Google Satellite is Google Satellite 1. Users who encounter problems with telecommunications network blocking and being unable to download Google images can use Google Satellite instead.
2.5 Why does the LSV image download result appear to be slanted?
The download result of LSV image is plane data, while the view in LSV is spherical data. The process from sphere to plane is map projection, and the projection process will produce projection deformation. Simply put, it is impossible to flatten a table tennis ball on a flat surface without damage. Projection deformation does not affect the accuracy of use. For friends who want to import the image download results into CAD for use, they need to re-project the image download results based on the benchmark and projection information of the CAD drawing, that is, transform the image data to the corresponding benchmark projection of the CAD drawing, and then load it into CAD, and it will be a complete match.
2.6 Why do all or a large number of LSV downloads fail?
The main reason for large-scale LSV download failures is that a large number of LSV downloads have been downloaded recently, or a friend in the same local area network has downloaded a large number of files. Currently, according to feedback from users and friends, if the number of image downloads in a day exceeds 30,000 tiles, access to Google Earth servers may be blocked by the operator. This shielding is relatively random, and this problem mainly exists in telecommunications networks. After encountering a block, you can try to run the gadget. In addition, random blocking will usually be unblocked within a few days.
3 Terrain (DEM)
3.1 What is the accuracy of LSV terrain download?
The terrain used by LSV is the terrain data of Google Earth. The original Google terrain data is SRTM3, and the original resolution of SRTM3 is 90m. All data below 90m are interpolated samples.
… On this point, we will not fool our users and friends by claiming 10m.
Therefore, it is recommended that users download 14-15 level data when downloading terrain. Downloading a level that is too large has no practical significance. It only prolongs the download time and increases the storage capacity, but does not mean that the data accuracy is increased.
3.2 Why can’t I view three-dimensional data in my LSV?Three-dimensional analysis is also not possible.
Can't see the terrain even in tilted viewing angles, and use LSV's built-in analysis tools and contour preview to not work properly. The specific reason is that either the terrain layer is not checked or loaded, or the Google Earth server cannot be connected to obtain online terrain.
Check the terrain on the left column to see if there is Google Terrain in it and check it. If there is no Google Terrain, go to Online Maps > Google Maps > Google Terrain to add it.
If there is and it is checked, use the gadget to check whether you can connect to the Google Earth server normally.
3.3 What public terrain data is available?
The current public terrain (DEM) data mainly include:
Approximately 15m resolution: SRTM-X-DLR (grid coverage)
30m resolution ones include: NGA-SRTM1, ASTER-GDEM-V2, NASA-SRTM1;
The ones with 90m resolution are: SRTM3.
These data can be downloaded for free from USGS or Geographic Cloud.
Figure New Earth Update Log
1. Optimize content
2. The details are more outstanding and the bugs are gone.
Huajun editor recommends:
The editor of Huajun Software Park has compiled and collected software that you may like, such as:Shanghai World Expo Online Tour,Hydrological Frequency Intelligent Analysis System,China high-speed rail map 2018 HD version,KStars,OpenCPNYou can download it from this site.








Useful
Useful
Useful