


- Green versionView
- Green versionView
- Green versionView
- Green versionView
- Green versionView
originlab software features
Exclude imported data when saving a project
With any data import (not just data connectors), users can choose to clear imported data when saving the project.
This allows your Analysis Project to remain small in size. You can simply re-import the data when needed to perform further analysis
HTML report
Origin Notes window now has "HTML mode"
Notes can be added to workbooks to create HTML reports within analysis templates
Supports placeholders in HTML that can be linked to report form elements such as calculation results and graphics
Copy and paste the folder
Copy the entire Origin project folder and paste it into the same project or even into another Origin session running on the same PC
Add Rugs to Axis
Add Rug markers to axes to indicate data density
Create graphics such as 2D scatter plots, histograms, core density plots, box plots, and more.
Opens the Axis dialog box. You will see a new "Rug" tab with options
Applicable to multiple graphs in the same layer
Export worksheets or books to Excel files..
Added support for exporting multi-sheet workbooks to multi-sheet Excel files.
Improve/reorganize menu
originlab function introduction
New workbook dialog box
Using the new workbook dialog box, you can:
1. Choose from the many workbook templates included with Origin. These templates are designed for specific tasks, such as linear calibration or analysis
2. From the User Templates tab, open your custom template.
3. Save custom templates with preview images and descriptive tips
4. Construct a new workbook with the required number of columns and drawing settings
5. Set any template as the default template. When you open a new project or create a new workbook, the workbook will be created using this template.
Graph Maker App
The new Graph Maker App provides an interactive way to explore relationships between multiple variables.
1. Create a plot by dragging and dropping variables from the column list
2. Quickly change the plot type, for example, from scatter plot to box plot
3. Use categorical variables to split the data into multiple panels vertically or horizontally
4. Use categorical or numerical data in other columns to specify symbol colors, symbol types, etc.
5. Create graphics in page view or draggable resizable window view. Window View lets you interactively drag the graph window and resize the graph to better view your data.
More first level menus to avoid having too many entries in each menu
All data imports are related to the data menu.
When the Graph window is active, there is an Insert menu to insert all types of things, such as drawings, graphic objects, tables, etc.
Plot menu reorganization
The most recently used categories are above.
Icons have been rearranged so users can view all drawing types in the same category at the same time.
Some context menu changes.
originlab instructions for use
Exclude imported data when saving a project
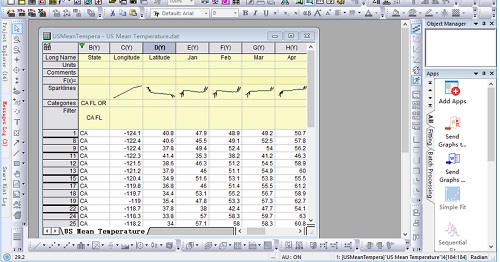
As the amount of data continues to increase, users are often faced with the challenge of keeping the original project file (OPJU) size small. If you choose to import and retain all data in the project, the project file size will become larger when your data size is large.
If the data files are available for future use in a reliable location, one option is to not save the data with the project and simply re-import the data when needed to perform any future analyses.
With this in mind, in Origin version 2019b, we have introduced an option to not save the imported data in the workbook when saving the project (OPJU) or saving the workbook (OGWU). This option is available in the Workbook Properties dialog box:
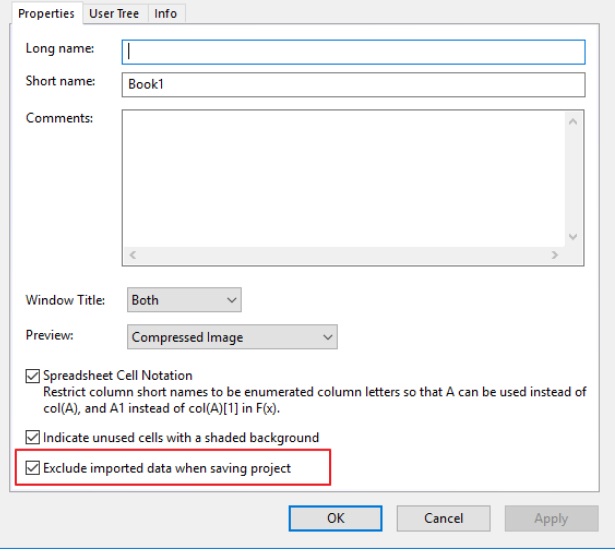
It is important to note that all output of the analysis performed on the imported data (e.g. calculating values in new columns, regressions, statistics, etc.) will be saved with the project, even if the imported raw data can be used for further plotting and analysis the data is not saved. This allows you to reopen the project and use the analysis results. If you want to change the results of an existing analysis or perform a new analysis on the original data, you can simply re-import the data. Of course, if you created any graphs directly from the original data, they will be empty until the data is reimported.
originlab update log
1. Optimized some functions
2. Solved many unbearable bugs
Huajun editor recommends:
The editor of originlab personally verified it, and it is clear that no one can be deceived! There are similar software on this siteToday's goal,Hanwang Attendance Management System,Aimo mind map,NTKO large file upload control,Kuai Dao Ke platform software, welcome to click to download and experience!


Useful
Useful
Useful