


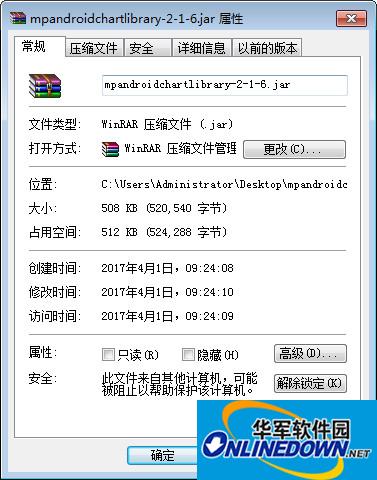
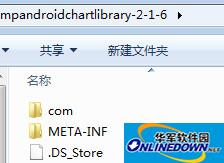
File preview
Usage examples
The following mainly implements the following pie chart:
1. Download the latest mpandroidchartlibrary.jar package, and then copy it to the libs of the project
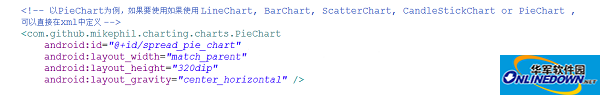
2. Define xml file
3. The main Java logic code is as follows, and the comments have been added.
package com.jackie.mpandroidpiechart;
import java.util.ArrayList;
import com.github.mikephil.charting.charts.PieChart;
import com.github.mikephil.charting.components.Legend;
import com.github.mikephil.charting.components.Legend.LegendPosition;
import com.github.mikephil.charting.data.Entry;
import com.github.mikephil.charting.data.PieData;
import com.github.mikephil.charting.data.PieDataSet;
import android.support.v7.app.ActionBarActivity;
import android.graphics.Color;
import android.os.Bundle;
import android.util.DisplayMetrics;
public class MainActivity extends ActionBarActivity {
private PieChart mChart;
@Override
protected void onCreate(Bundle savedInstanceState) {
super.onCreate(savedInstanceState);
setContentView(R.layout.activity_main);
mChart = (PieChart) findViewById(R.id.spread_pie_chart);
PieData mPieData = getPieData(4, 100);
showChart(mChart, mPieData);
}
private void showChart(PieChart pieChart, PieData pieData) {
pieChart.setHoleColorTransparent(true);
pieChart.setHoleRadius(60f); //Radius
pieChart.setTransparentCircleRadius(64f); // Translucent circle
//pieChart.setHoleRadius(0) //Solid circle
pieChart.setDescription("Test pie chart");
// mChart.setDrawYValues(true);
pieChart.setDrawCenterText(true); //Text can be added in the middle of the pie chart
pieChart.setDrawHoleEnabled(true);
pieChart.setRotationAngle(90); // Initial rotation angle
// draws the corresponding description value into the slice
// mChart.setDrawXValues(true);
// enable rotation of the chart by touch
pieChart.setRotationEnabled(true); // Can be rotated manually
//display percentage values
pieChart.setUsePercentValues(true); //Displayed as a percentage
// mChart.setUnit(" €");
// mChart.setDrawUnitsInChart(true);
// add a selection listener
// mChart.setOnChartValueSelectedListener(this);
// mChart.setTouchEnabled(false);
// mChart.setOnAnimationListener(this);
pieChart.setCenterText("Quarterly Revenue"); //Text in the middle of the pie chart
//Set data
pieChart.setData(pieData);
// undo all highlights
// pieChart.highlightValues(null);
// pieChart.invalidate();
Legend mLegend = pieChart.getLegend(); //Set the scale chart
mLegend.setPosition(LegendPosition.RIGHT_OF_CHART); //The rightmost display
// mLegend.setForm(LegendForm.LINE); //Set the shape of the proportion diagram, the default is square
mLegend.setXEntrySpace(7f);
mLegend.setYEntrySpace(5f);
pieChart.animateXY(1000, 1000); //Set animation
// mChart.spin(2000, 0, 360);
}
/**
*
* @param count divided into several parts
* @param range
*/
private PieData getPieData(int count, float range) {
ArrayList<String> xValues = new ArrayList<String>(); //xVals is used to represent the content on each pie piece
for (int i = 0; i < count; i++) {
xValues.add("Quarterly" + (i + 1)); //The pie pieces are displayed as Quarterly1, Quarterly2, Quarterly3, Quarterly4
}
ArrayList<Entry> yValues = new ArrayList<Entry>(); //yVals is used to represent the actual data encapsulating each pie piece
// Pie chart data
/**
* Divide a pie chart into four parts, and the numerical ratio of the four parts is 14:14:34:38
* So the percentage represented by 14 is 14%
*/
float quarterly1 = 14;
float quarterly2 = 14;
float quarterly3 = 34;
float quarterly4 = 38;
yValues.add(new Entry(quarterly1, 0));
yValues.add(new Entry(quarterly2, 1));
yValues.add(new Entry(quarterly3, 2));
yValues.add(new Entry(quarterly4, 3));
//Collection of y-axis
PieDataSet pieDataSet = new PieDataSet(yValues, "Quarterly Revenue 2014"/*Displayed on the scale chart*/);
pieDataSet.setSliceSpace(0f); //Set the distance between pie charts
ArrayList<Integer> colors = new ArrayList<Integer>();
// Pie chart color
colors.add(Color.rgb(205, 205, 205));
colors.add(Color.rgb(114, 188, 223));
colors.add(Color.rgb(255, 123, 124));
colors.add(Color.rgb(57, 135, 200));
pieDataSet.setColors(colors);
DisplayMetrics metrics = getResources().getDisplayMetrics();
float px = 5 * (metrics.densityDpi / 160f);
pieDataSet.setSelectionShift(px); // Extra length of selected state
PieData pieData = new PieData(xValues, pieDataSet);
return pieData;
}
}
The renderings are as follows:
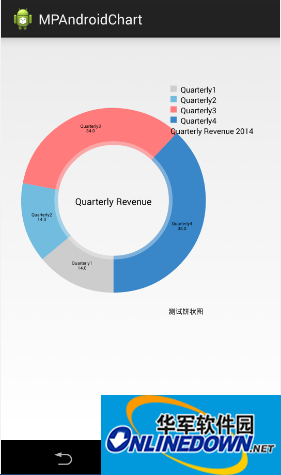
It is mainly about some basic attributes and API calls. You can only try it by yourself to determine the specific effects and functions of each API. We will introduce other types of charts in MPAndroidChart to you later.


Useful
Useful
Useful