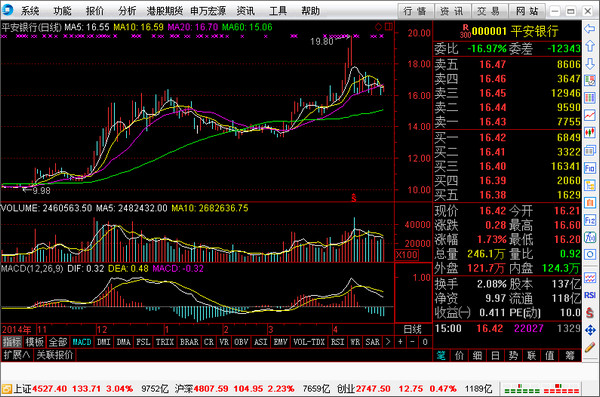
Instructions for use
Function buttons on the time-sharing trend screen:
Screen operation: To view the trend screen of different time periods, you can do the following operations:
Previous day's trend (Shift-←/114): View the trend chart of the previous day on the current screen.
Trend of the next day (Shift-→/115): View the trend chart of the day after the current screen.
Trend of the day: Switch to the trend chart of the day.
Change date: View the trend chart of the selected date (within 10 days)
Add multi-day trend (↓): View the continuous trend analysis chart for one day more than the current one. You can view continuous charts for up to 5 days.
Reduce multi-day trend (↑): View the continuous trend analysis chart for one day less than the current one. You can view continuous charts for up to 5 days.
Note: The background of the current day's trend chart is black; the background of the historical trend chart is gray.
Export: Export the data being browsed.
Brush: For indicator sorting, statistics and filtering. Based on the latest data, re-calculate statistics, sort, screen stocks, and refresh all data in the current report.








Useful
Useful
Useful