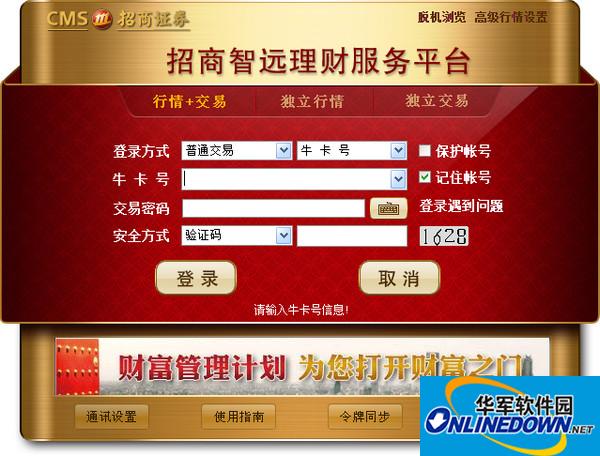
Instructions for use
Some explanations on the design of China Merchants Securities Zhiyuan Financial Services Platform
"B", "S" marks in separate transactions
"B" means an active buying order (Buy) "S" means an active selling order (Sell)
An order without a BS mark indicates an unknown order. The system cannot determine whether it is an active buy or sell order based on the current buy and sell prices.
What do the gray numbers on the far right in the transaction details represent?
In the market data released by the exchange, each transaction is not just one transaction, but may be a combination of several transactions. The data released by the Shenzhen Stock Exchange has transaction number information, and the gray number is how many transactions are actually included in the transaction data.
What does it mean when some transaction volumes in transaction details and market information are purple?
Indicates a large order. By default, orders above 500 lots are large orders. This value can be adjusted through "System Settings"->"Parameter 1"->Current Highlighted Volume.
What does the bidding rate in the F2 price list mean?
The bidding rate indicates the proportion of active buying volume in the volume traded at this price.
What is the meaning of the color of the trading volume column line on the time-sharing chart of China Merchants Securities Zhiyuan Financial Services Platform?
When "color display of trading volume interval in time-sharing chart" is turned on in the system settings, the trading volume in the time-sharing chart is no longer a single trading volume color, but has three colors: red indicates that the trading volume is in the process of price increase. Transactions; green indicates that the transaction volume was executed when the price fell; white indicates that the transaction volume was executed while the price remained unchanged.
What does the G or L logo mean before the security name in the market information area in the upper right corner?
G indicates that this stock has share reform information. Click it to see detailed consideration and commitment information.
L indicates that this stock has related products, such as B shares, convertible bonds, H shares or warrants, etc. Click it to switch to related products.
About quantity ratio
Volume ratio is an indicator that measures relative trading volume. It is the ratio of the average trading volume per minute after the market opens to the average trading volume per minute for the past 5 trading days. A volume ratio value greater than 1 indicates that the average trading volume per minute on that day is greater than the average value of the past five trading days, and the trading volume is enlarged; a volume ratio value of less than 1 indicates that the current trading volume is not as good as the average level of the past five trading days, and the trading volume is shrinking.
In the time-sharing chart, the meaning of the volume ratio chart that appears by pressing the /* key:
If there is a sudden increase in volume, the volume ratio indicator chart will have an upward breakthrough. The steeper it is, the greater the increase in volume; if there is a shrinkage, the volume ratio indicator will move downward.
Explanation of the long and short red and green forces of China Merchants Securities Zhiyuan Financial Services Platform:
There are two square bars on the status bar, the left is the long and short bar of the Shanghai stock market, and the right is the long and short bar of the Shenzhen stock market.
The long and short bar is divided into two parts:
To the left is the proportion of rising stocks (red, if it is dark red, it means the daily limit part),
To the right is the proportion of stocks that fell (green, if it is dark green, it means the part that fell to the limit)
There are 6 different symbols scrolling under the grid:
Red upward arrow: indicates that the overall market rally is increasing
Red downward arrow: indicates that the overall market rally is weakening
Red equal sign: indicates that the overall market trend remains flat
Green upward arrow: indicates that the overall market decline is increasing
Green downward arrow: indicates that the overall market decline is weakening
Green equal sign: indicates that the overall market decline remains flat
Users can use shortcut keys such as F1~F12, Ctrl+letters, Alt+letters, etc. The shortcut keys supported by this system are as follows:
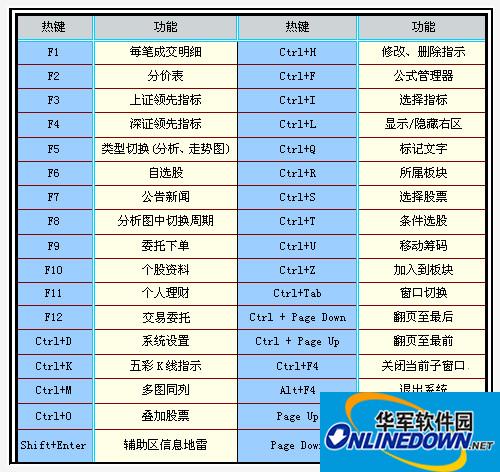
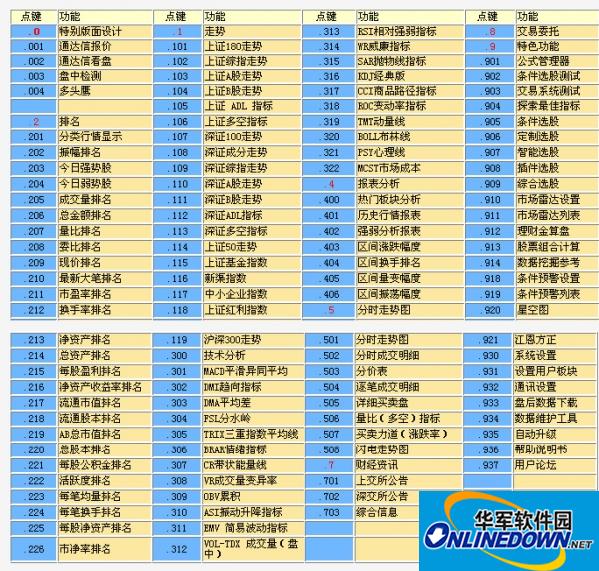
Click the sequence key:
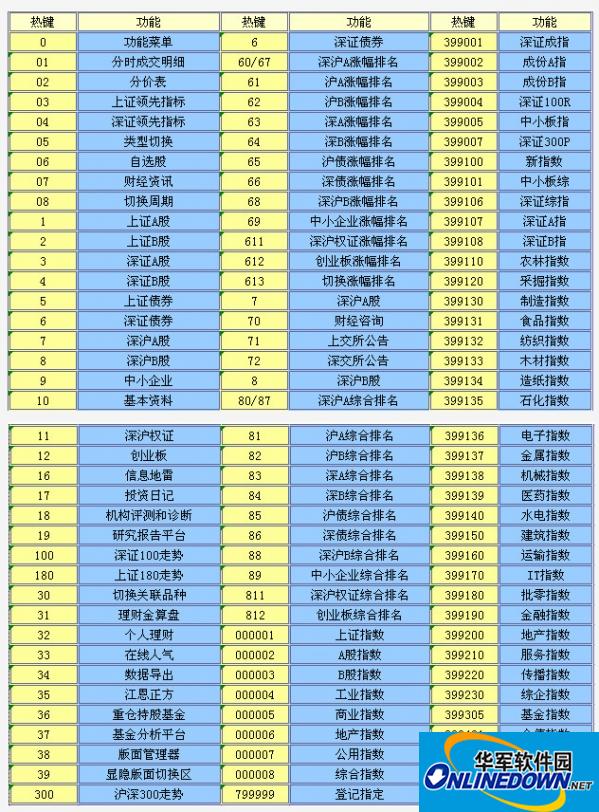
Keyboard Wizard:

Lightning trading shortcut keys:
Development history
China Merchants Securities has grown together with China's capital market. It was founded in Shenzhen in 1991 and has gone through 25 years of development so far.
In July 2002, in order to pursue internationalization, the company changed its name to China Merchants Securities Co., Ltd. and achieved its third leap.
On November 17, 2009, China Merchants Securities was listed on the Shanghai Stock Exchange with an issue price of 31 yuan. The price-to-earnings ratio is as high as 56.26 times. Many brokerage firms have valued China Merchants Securities well below its issue price. Shenyin Wanguo believes that the reasonable price of China Merchants Securities after listing is 25 yuan, while CICC gave a valuation of 18 yuan to 22 yuan.










it works
it works
it works