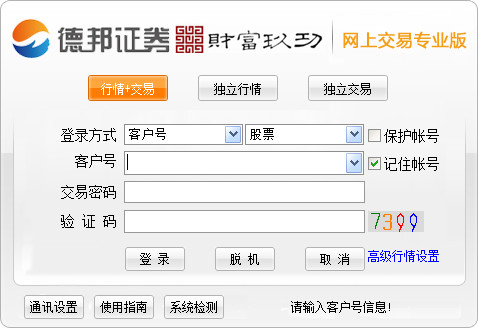
Introduction to the interface of Debon Securities Tongdaxin Professional Edition
[Menu Bar] is located in the upper left corner of the system screen and includes eight columns including system, function, quotation, analysis, information, Hong Kong stock futures, tools, and help. Press Alt and the letter next to the menu at the same time to select the pop-up drop-down list, and press the corresponding letter key to select the function.
[Title display area] is located at the upper right of the system screen and on the right side of the menu bar. In addition to marking the system name, it also displays the information of the current window.
[Status bar] is located at the bottom of the screen and is divided into four parts: index bar, traffic light, system display area, early warning (online version, graphic version)/data display area (after-hours version).
[Toolbar] The system displays the toolbar at the left end of the screen by default, which can be dragged and dropped to any position. It is divided into main function icon buttons (the first ten items) and dynamic icon buttons (after the tenth item, different icon buttons correspond to different windows).

[Function Tree] On the left or right side of the screen (change its position through system settings), there are five trees including homepage, functions, information, stocks, and indicators, covering most of the system's functions and operations.
[Auxiliary area] At the bottom of the screen, it includes information mines, classified information, and individual stock memos.
[Window] is an interface displayed in the middle of the screen for users to browse and analyze. It is divided into main window and sub-window.
[Main window] refers to the system’s default market window.
[Sub-window] includes combination window (including analysis chart, time-sharing chart and combination of various graphics), report analysis window, individual stock data window, and announcement information window.
[Information bar on the right] is located at the right end of the combination window (can be hidden), showing price, quantity and other information.
[Function switching area] The bottom of the information bar on the right is divided into Pen, Price, Details, Market, Potential, Index, Value, and Chips, corresponding to different information bar small windows to display content.
[Cycle switching area] The combination window is located on the left side of the function switching area. Cycle switching can be performed by using the right-click menu of the mouse, "[", "]", F8 or the toolbar dynamic icon button.
[Cursor] In the combination window, when the mouse or cursor moves, the changes corresponding to the Y-axis and the time axis are displayed in blue.
[Mouse Companion] The yellow background information box displayed when the mouse is parked on K-lines, indicators, toolbar icon buttons or various indicators.
[Analysis Chart Information Dialog Box] The left and right arrows in the analysis chart bring up a dialog box that changes the price, quantity and other information accordingly as the cursor moves.
Debon Securities Tongdaxin Professional Edition Update Log
New functions of stock transfer and Hong Kong Stock Connect are added, and futures quotation services are supported.


it works
it works
it works