


The function is borrowed from Microsoft's (SYSINTERNAL) PROCMON tool. PROCMON's ability to analyze network activities is not strong enough.
Some data input/output is not traced, and peripherals, pipes, and mail slots are not traced.
In other aspects, the system tracker effect is basically the same as PROCMON.
Considering the tracking speed, the current system tracker only supports saving recording information in memory, and can record system activities over a period of time in real time.
1. Capture the behavior within the WINDOWS system and display the behavior content to the user through a focused and differentiated UI interface.
2. Provide analysis method support to make it easy for users to understand the current internal activities of the computer.
3. Provide adjustment and processing tools to adjust and process the corresponding system status and behavior.
4. Behavioral data content capture and analysis.
5. Analysis of the meaning of network data.
6. Detailed analysis of USB device communication process.
7. Detailed analysis of serial device communication process.
8 Diverse filtering strategy customization can solve problems in specific scenarios in a targeted manner.
Application examples:
1. It is found that a certain data file in the computer has been rewritten. By starting and running BITTRACE at the corresponding time for a period of time and checking the analysis log, the reason for the data file being rewritten can be found.
2. If the hard disk light is on, run BITTRACE to analyze which programs are currently accessing files and hard disks, and which of them are unknown programs.
3. View and analyze the ongoing communication on the network. To ensure the legality and correctness of network communications. You can turn on BITTRACE when necessary to view and analyze specific network communication content.
4. If the ANDROID device is found to be unresponsive, analyze the USB peripheral log and observe whether there is a correct USB communication process when executing the corresponding command.
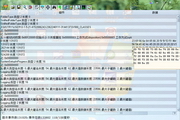
System peripheral event tracker (BITTRACE) interface introduction:
The interface is divided into two main panels:
1. System behavior tracking output interface 2. About the information interface The main panel is switched through the two main buttons at the top.
System behavior tracking output interface structure:
The middle part is the trace output list interface, in which a line represents a system behavior, explaining:
When does it happen?
Which program executes it?
What is the event? Files, registry, network communications, starting and closing new programs, and other key system activities.
What is the object being accessed? A certain file, a certain registry configuration item, a certain program, a certain network IP address, key system objects, etc.
What are the results of the visit?
What content is being accessed? Specific file read/write data content, specific registry key value content, specific network communication data content, etc.
The upper part of the output interface is a behavioral analysis tool, including:
Enable/pause tracking.
Clear the current tracked content.
Customize conditions to filter key parts of the currently tracked content.
By moving the pointer over the form of interest, the trace shows only the behavior of the program corresponding to the form.
Jump to this access object and open the directory or registry key of this object.
Filter by behavior type.
The lower part of the output interface is the tracking status information output.


Useful
Useful
Useful