ollydbg (od disassembly tool)It is the current mainstream dynamic tracking and debugging tool for reverse engineering. ollydbg (od disassembly tool) is suitable for 32-bit dynamic debugging. Global labels can be inserted at any time during the debugging process. The process is intuitive and concise. It is an essential debugging tool for disassembly work. Huajun Software Park provides you with free download of od disassembly tool 2024. Friends who like od disassembly tool come to Huajun Software Park to download and experience it!

How to use ollydbg (od disassembly tool)
No matter what the current OllyDbg window is, these shortcut keys are valid:
Ctrl+F2 - Restart the program, that is, restart the program being debugged. If there is no program currently being debugged, OllyDbg will run the first program in the history list [historylist]. After the program is restarted, all memory breakpoints and hardware breakpoints will be deleted.
Translator’s Note: Judging from the actual use effect, the hardware breakpoint is not removed after the program is restarted.
F3 - The "Open 32-bit .EXE file" dialog box pops up. You can select the executable file and enter the running parameters.
F7 - Single-step to the next command. If the current command is a function [Call], it will stop at the first command of the function body. If the current command contains the REP prefix, only one repeat operation will be performed.
F8 - Step forward to the next command. If the current command is a function, the function will be executed once (unless the function contains a breakpoint or an exception occurs). If the current command contains the REP prefix, the repeated operation will be executed and stop at the next command.
F9 - Let the program continue execution.
Ctrl+F11-Run trace steps in, executes commands one by one, enters each sub-function call, and adds register information to the stored data of Run trace. Run tracing does not update the CPU window synchronously.
F12 - Stops program execution and suspends all threads of the program being debugged. Please do not resume thread execution manually, use the resume shortcut key or menu option (like F9).
Alt+B - Show breakpoint window. In this window, you can edit, delete, or follow to the breakpoint.
Alt+C - Display the CPU window.
Alt+E - Display the list of modules.
Alt+K - Display the call stack window.
Alt+L - Show the log window.
Alt+M - Show the memory window.
Alt+O - Display Options dialog
Ctrl+P - Show patch window.
Ctrl+T - Open the Pause Run Tracking dialog box
Alt+X - Close OllyDbg.
Introduction to the functions of ollydbg (od disassembly tool)
start
You can specify the executable file in the form of a command line, select it from the menu, drag and drop it directly into OllyDbg, restart the last debugged program, or attach [Attach] a running program. OllyDbg supports on-the-fly debugging, does not require installation at all, and can be run directly on a floppy disk!
thread
ollydbg (od disassembly tool) can debug multi-threaded programs. So you can switch between multiple threads, suspend, resume, terminate threads or change thread priority. And the thread window will show errors for each thread (just like what was returned from calling GETLASTERROR).
Debugging DLLs
You can use OllyDbg to debug standard dynamic link libraries (DLLs). OllyDbg will automatically run an executable program. This program loads the library and allows you to call the library's output functions.
Source level debugging
ollydbg (od disassembly tool) can recognize all Borland and Microsoft format debugging information. This information includes source code, function names, labels, global variables, and static variables. Limited support for dynamic (stack) variables and structures.
code highlighting
The disassembler of ollydbg (od disassembly tool) can highlight different types of instructions (such as jumps, conditional jumps, push onto the stack, pop out of the stack, calls, returns, special or invalid instructions) and different operands (general, FPU/SSE, segment/system registers, operands on the stack or in memory, constants). You can customize your own highlighting scheme.
Name
ollydbg (od disassembly tool) can display input/output symbols and names based on debugging information in Borland and Microsoft formats. Object scanners can identify library functions. You can add any names and comments you want. If some functions in the DLL are exported by index numbers, you can restore the original function names by hooking the import library. Not only that, OllyDbg can also recognize a large number of constant symbol names (such as window messages, error codes, bit fields...) and decode them into known function calls.
known function
ollydbg (od disassembly tool) can identify more than 2300 common functions in C and Windows APIs and the parameters they use. You can add description information and predefined decoding. You can also set Log breakpoints on known functions and record parameters.
function call
ollydbg (od disassembly tool) can backtrace recursive calls without debugging information or when the function process uses non-standard beginning parts [prolog] and end parts [epilog].
Configuration
There are more than a hundred options for setting the appearance and operation of OllyDbg.
Data format: OllyDbg’s data window can display all data formats: HEX, ASCII, UNICODE, 16/32-bit signed/unsigned/HEX integers, 32/64/80-bit floating point numbers, addresses, disassembly (MASM, IDEAL or HLA), PE file headers or thread data blocks.
Operating environment
ollydbg (od disassembly tool) can work in any Windows 95, 98, ME, NT or XP (not fully tested) operating system using a Pentium processor, but we strongly recommend that you use a Pentium processor above 300-MHz to achieve better results. Also, OllyDbg takes up a lot of memory, so if you need to use extended functions such as trace debugging [Trace], it is recommended that you use more than 128MB of memory.
Supported processors
ollydbg (od disassembly tool) supports all 80x86, Pentium, MMX, 3DNOW! , Athlon extended instruction set, SSE instruction set and related data formats, but the SSE2 instruction set is not supported.
ollydbg (od disassembly tool) installation instructions
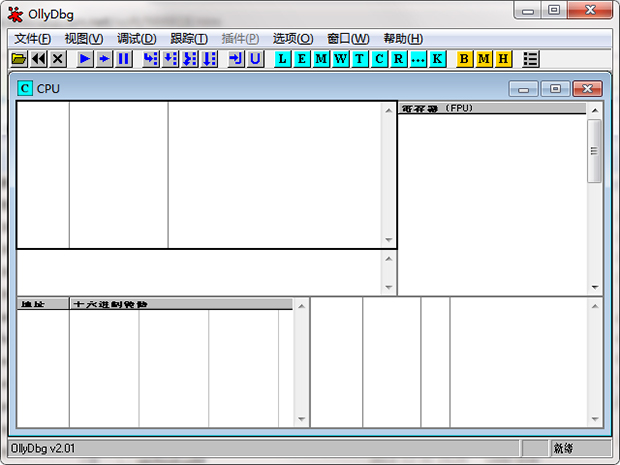
ollydbg (od disassembly tool) is green and requires no installation, and can be opened directly by double-clicking it.
Introduction to the interface of ollydbg (od disassembly tool)
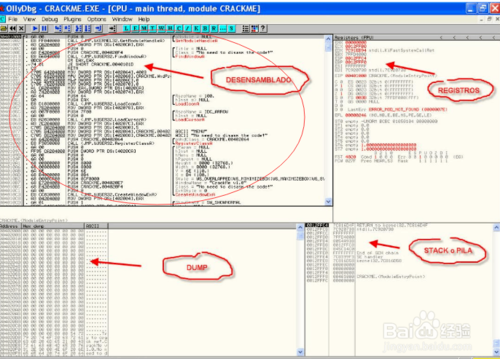
1. Disassembly window
ollydbg (od disassembly tool) displays the disassembly code here. We are going to debug and analyze the program you open with OllyDbg's default configuration. Debugging options can be changed in Options->Debugging options.

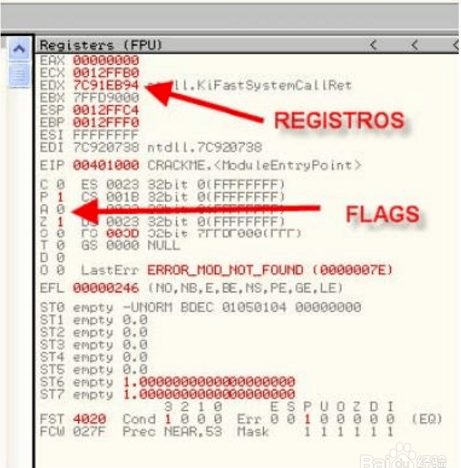
2. Register
The second important window is the register window. Take a look at this window on the far right of OllyDbg, it has a lot of information.

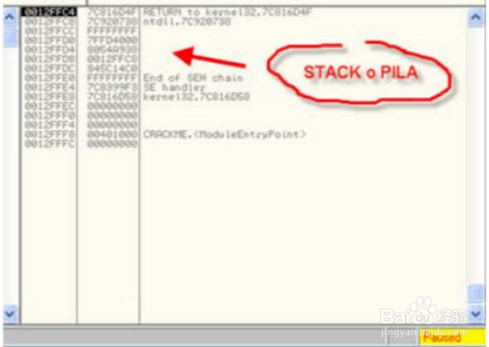
3. Stack window
By default, it displays the information pointed to by the ESP register (and the most important one), but you can change its display mode to display information from the EBP register. This requires right-clicking on this window and selecting GO to EBP. Right-click again and select Go to ESP to return to the previous window.

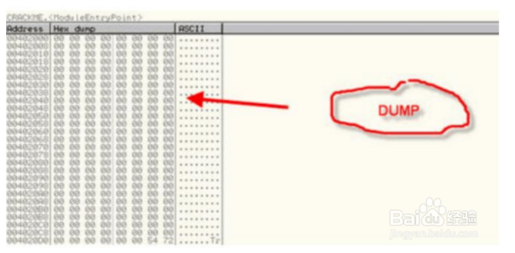
4. Data window(dump)
The default mode is the most commonly used, and we can also change it to display disassembled code (Disassemble), text (Text) and other formats (Short, Long, Float). Now we understand the four main windows of OllyDbg. There are also windows that are not displayed directly and can be accessed through menus or icon buttons on the control panel.

ollydbg (od disassembly tool) FAQ
How to save the debugging information of ollydbg for next time use?
Debug menu -> Select the symbol path and then set the path in the pop-up dialog box. Note that the debugging file is in udd format. When the path of the debugged file changes, the debugging information is no longer available. For example: after you have a file on the C drive and use ollydby to debug it and add a watch or breakpoint, move the file to another path, and then use ollydbg to open the debug information watch and breakpoints will not be displayed.
Note: The breakpoints and comments window can only view the breakpoints and comments of the current module, and the breakpoints and comments currently analyzed as code by ollydbg can be seen.
ollydbg (od disassembly tool) update log
1. The interface uses a beautified interface produced by BoOMBoX/TSRh2004, mainly for the sake of looking better.
2. Most of the sentences have been re-translated to try to be accurate.
3. Except for the font, syntax highlighting, and colors that remain in Chinese, the rest of the configuration file is restored to English. Keep the fonts, syntax highlighting, and colors in Chinese.
4. The fonts, syntax highlighting, and colors in the configuration file were restored to English. A patch was made to restore the English configuration and placed in the English configuration patch directory. Friends who need the fonts, syntax highlighting, and colors to be configured in English can put this patch in the installation directory and select the Ollydbg.exe patch.
Huajun editor recommends:
The od disassembly tool is a high-performance software that meets everyone's requirements. The software is free and non-toxic, and has well-received software. Our Huajun Software Park has the most authoritative software, green and free, officially authorized, and there are also similar fast table software, AlphaEbot action editing software, and He Xiaoxiang programming client. I hope everyone will come to download it!


