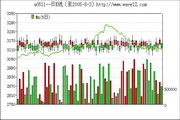
u3000u30001. Production of various styles of statistical charts, including bar charts, line charts, pie charts, Plato charts, point charts, etc.;
u3000u30002, output files in multiple formats, including BMP, JPG, GIF and other formats, with customized output quality;
u3000u30003, you can add lines, text, and pictures at any position;
u3000u30004, the statistical results can be output directly to the browser, including BMP, JPG and GIF formats;
u3000u30005, column chart supports sequence data group comparison;
u3000u30006, chart filling method supports picture filling;
u3000u30007, dozens of properties to flexibly control chart layout and appearance, supporting transparency and progressive functions;
u3000u30008, supports the function of moving the mouse up to display data;
u3000u30009, when the component is used for WEB development, it only needs to be registered on the server side and does not require client installation;
u3000u300010, flexible interface design, suitable for VB, VC, DELPHI and other development tools;
u3000u300011 has stable performance, consumes very little system resources, and has no memory leaks.


it works
it works
it works