ECharts graphic design software is a very easy-to-use professional graphics and image processing tool. Its main function is to help users quickly produce corporate graphic copywriting, etc., and improve the intuitiveness of the copywriting through the combination of graphics and images! Different from professional images, it tends to be bitmaps and logo icons!
Application introduction:
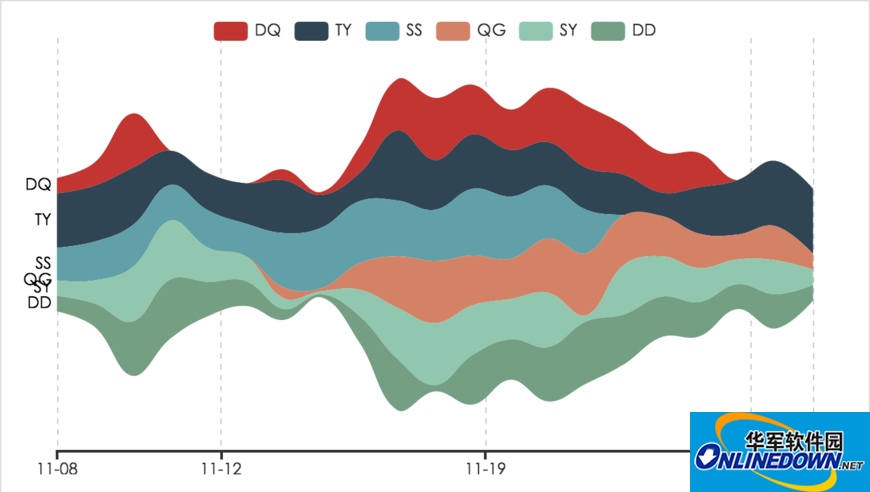
In the new version of ECharts, three new charts have been added: pictogram bar chart, theme river chart, and water polo chart. Pictograms use pictures and shapes to represent data. Thematic river charts can be used to represent changes in events or themes over a period of time. Water polo charts are often used to display percentage data.
Application product features:
【Pictogram】
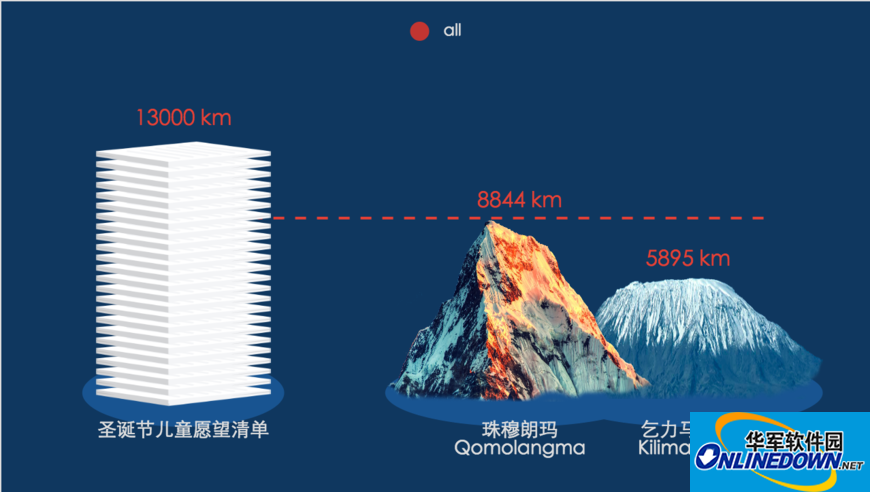
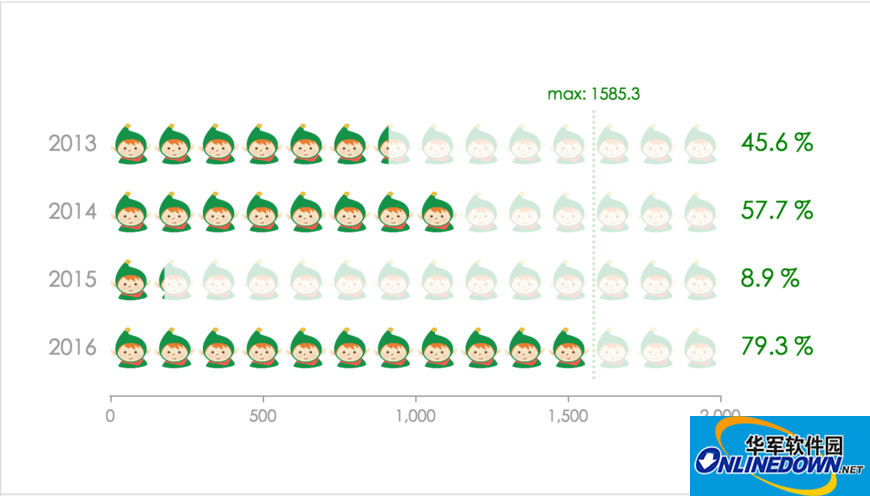
A pictographic column chart is a column chart that can be set with various concrete graphic elements (such as pictures, SVG PathData, etc.). Often used in information graphics, used on a rectangular coordinate system with at least one category axis or time axis.
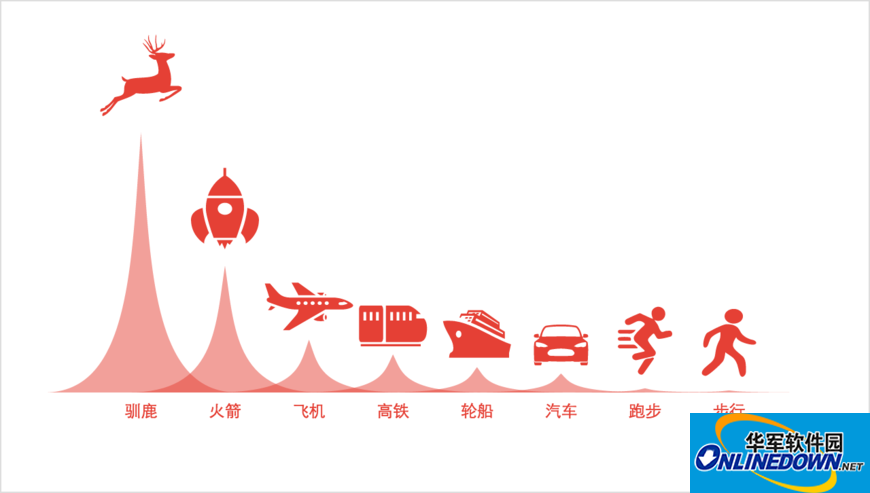
In the ECharts Christmas activity page, we created the following speed comparison chart of reindeer and transportation modes. Such a chart can be easily implemented using ECharts pictogram bar chart.
[Table Value Data Chart]
In addition, the pictogram column chart can also use the number of the same graphic to represent values, achieving an effect similar to a group of elves on the ECharts Christmas activity page. Therefore, the pictographic column chart can largely meet the drawing needs of information graphics.
[Geographical Tips Map]
The topic river diagram is a special type of flow diagram, which is mainly used to represent changes in events or topics over a period of time. Different colored striped river branches in the topic river encode different events or topics, and the width of the river branch encodes the value in the original data set. In addition, the time attributes in the original data set are mapped to a single timeline.
【Dynamic logo】
The use of the water polo chart is very simple. To achieve the following effects, you only need to set the series type to liquidFill and specify the data.

New version update features:
1. Map series can now use the user-specified geo coordinate system (originally, only the built-in geo coordinate system can be used). Thus, the geo coordinate system can use map series to control its own color, and map series can share the geo coordinate system with other types of series (such as scatter series). See series-map.geoIndex.
2. Added focusNodeAdjacency action, so that the API can be used to control graph connection highlighting.
3. Added series-pie.animationType to support different pie chart animation effects.
4. animationDuration adds callback function support, which can get different animation durations based on different data items.
5. Category axis supports the setting of min max.
6. Category axis will display all categories by default, regardless of whether there is no data in the category (the original categories without data at both ends will not be displayed).
7. data in singleAxis supports the data format of one-dimensional array, such as [11, 23, 44].
8. dataZoom supports singleAxis.
9. Opened the throttle tool method: chart.util.throttle.
10. Optimized the display effect when all data in the Cartesian coordinate system is not displayed.
11. K-line chart supports barWidth, barMinWidth, barMaxWidth settings.
12. Line graph supports symbol and symbolSize settings.
13. Supports simultaneous display of data labels and first and last text in visualMap-piecewise. See visualMap-piecewise.showLabel.
14. Supported visualMap. Some data in the support series are not controlled by visualMap.
15. The dataIndex parameter is enabled in the showTip event.
16. Fixed the XSS vulnerability in tooltip.
17. Fixed the problem that some properties in series-graph.edgeLabel were invalid.
18. Fixed the tick rendering problem in series-gauge when min max is stirng.
19. Fixed the problem of series-gauge.pointer.show.
20. Fixed the problem that series-radar may throw an error when rendering when there is no data.
21. Fixed the problem of markArea.label.normal.show.
22. Optimized the processing when the data is less than or equal to 0 in the log axis.


