


VisualVMFunction introduction
1. Main methods of performance analysis
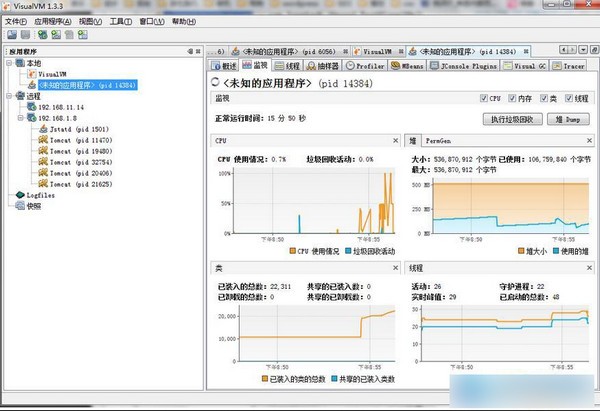
1. Monitoring: Monitoring is a general method used to view the runtime behavior of an application. Usually there are multiple views (View) that display the CPU in real time. Usage, memory usage, thread status and other useful information so that users can quickly find the key to the problem.
2. Dump: The performance analysis tool obtains the current status data from the memory and stores it in a file for static performance analysis. Java programs are started by starting Java The program adds appropriate conditional parameters to trigger the dump operation. It includes the following three types:
System dump: A dump of the local system generated by the JVM, also called a core dump. Generally, the system dump data is large and requires platform-related tools to analyze, such as windbg and Windows. gdb on Linux.
Java dump: Formatted data generated internally by the JVM, including thread information, class loading information and heap statistics. Also commonly used to detect deadlocks.
Heap dump: JVM stores the heap contents of all objects to a file.
2. Snapshot:
After the application starts, the performance analysis tool begins to collect various runtime data, some of which is displayed directly in the monitoring view, while most of the other data is saved internally until the user requests a snapshot, and statistics based on these saved data are displayed. Snapshots contain application execution information over a period of time, usually There are two types: CPU snapshot and memory snapshot.
CPU snapshot: mainly includes the calling relationship and running time of functions in the application. This information can usually be viewed in the CPU snapshot view.
Memory snapshot: mainly includes memory allocation and usage, all loaded classes, existing object information and reference relationships between objects, etc. This information can usually be viewed in the memory snapshot view.
3. Performance analysis:
Performance analysis helps developers locate the parts of the program that need to be optimized by collecting execution data when the program is running, thereby improving the running speed or memory usage efficiency of the program. There are mainly three aspects:
CPU performance analysis: The main purpose of CPU performance analysis is to count function calls and execution times, or in a simpler case, to count the CPU usage of the application. Usually there is a CPU Monitoring and CPU snapshot are used to display CPU performance analysis results.
Memory performance analysis: The main purpose of memory performance analysis is to detect possible memory leaks and determine the direction of optimizing memory usage through statistical memory usage. There are usually two ways to display memory performance analysis results: memory monitoring and memory snapshots.
Thread performance analysis: Thread performance analysis is mainly used to identify memory problems in multi-threaded applications. Generally includes the status changes of threads, deadlock situations and the distribution of status of a thread during the thread life cycle, etc.
VisualVMSoftware features
1. Memory analysis
VisualVM helps us analyze memory usage by detecting class and object information loaded in the JVM. We can use VisualVM’s monitoring tags and Profiler Tags perform memory analysis on applications.
2. CPU analysis
VisualVM can monitor the CPU usage of the application over a period of time and display the CPU Relevant data such as usage, method execution efficiency and frequency help us find performance bottlenecks in the application. We can monitor the application through VisualVM's monitoring tag and Profiler tag. CPU performance analysis.
3. Thread analysis
Java The language can implement multi-threaded applications very well. When we debug a multi-threaded application or do performance tuning in the later stages of development, we often need to understand the running status of all threads in the current program, whether deadlocks, hot locks, etc. have occurred, so as to analyze possible problems in the system.
4. Snapshot analysis
We can use VisualVM The snapshot function generates any performance analysis snapshot and saves it locally to assist us in performance analysis. Snapshots provide a very convenient way to capture application performance analysis data because once generated, the snapshot can be opened and viewed offline at any time, and can also be circulated to each other.
VisualVM provides two types of snapshots:
Profiler snapshot: When there is a performance analysis session (memory or CPU) in progress, we can generate a Profiler through the "Snapshot" button on the performance analysis results toolbar Snapshots capture performance analysis data at that time.
Application snapshot: We can right-click Applications on the left In the application node in the window, select "Application Snapshot" to generate an application snapshot. Application snapshots collect heap dumps, thread dumps and Profiler snapshots at a certain time, and also capture JVM some basic information.
5. Dump function
Generation and analysis of thread dumps: VisualVM It can generate thread dumps for running local applications and print out stack traces of active threads, helping us to effectively understand thread running conditions and diagnose deadlocks, application paralysis and other problems.
Generation and analysis of heap dumps: VisualVM can generate heap dumps and count the JVM usage at a specific moment The object information in it helps us analyze the reference relationships of objects, whether there are memory leaks, etc.
VisualVMInstallation steps
VisualVM is a performance analysis tool that has been part of Oracle JDK since JDK 6 Update 7 and is located in the bin of the JDK root directory. folder. VisualVM itself needs to run on JDK6 or above, but it can monitor applications on JDK1.4 or above. The following mainly introduces how to install VisualVM and various plugins on VisualVM.
1. Install VisualVM
1. Unzip the VisualVM installer to the local system.
2. Navigate to the bin directory of the VisualVM installation directory, and then start jvisualvm.exe.
2. Install the plug-in on VisualVM
The VisualVM Plug-in Center provides many plug-ins for installation to add functionality to VisualVM. Can be installed through the VisualVM application, or from VisualVM Manually download the plug-in in the plug-in center and then install it offline. In addition, users can also install third-party plug-ins to add functionality to VisualVM by downloading plug-in distribution files (.nbm files).
1. VisualVM plug-in center installation plug-in installation steps:
Select "Tools" > "Plugins" from the main menu.
In the "Available Plug-ins" tab, select the "Install" checkbox for the plug-in. Click Install.
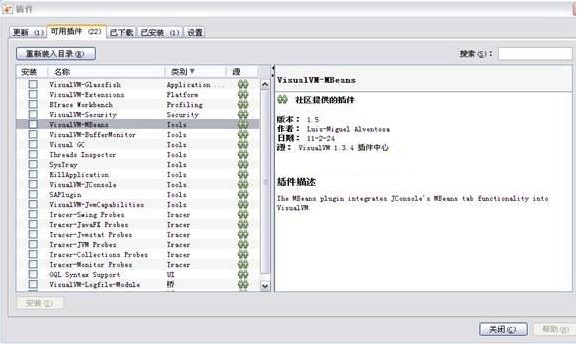
Step through the plugin installation process.
2. Select "Tools" > "Plugins" from the main menu.
In the "Downloaded" tab, click the "Add Plug-in" button, select the downloaded plug-in distribution file (.nbm) and open it.
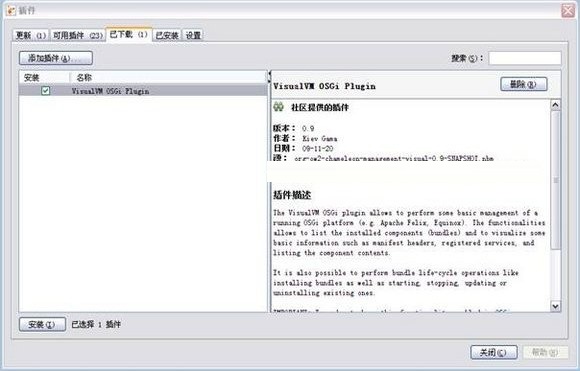
Select the open plug-in distribution file and click the "Install" button to gradually complete the plug-in installation process.
VisualVM FAQ
Missing dependencies
Problem description: Newbies may encounter missing dependencies when trying to build a VisualVM project, such as missing Apache Ant or Oracle JDK.
Solution:
Make sure that Apache Ant 1.9.15 or higher is installed, which can be downloaded and installed from the Apache Ant official website.
Make sure Oracle JDK 8 is installed, which can be downloaded and installed from the Oracle official website.
Add the installation paths of Ant and JDK to the system's environment variables to ensure that the command line tools can recognize these paths.
VisualVMChange log
Changes
Features and improvements.
GH-260: Full support for running on JDK 16 and monitoring/profiling Java 16 processes
GH-262: Add support for Apple M1
GH-270: Import plugins from previous VisualVM versions
GH-275: Add information about enabling modules
GH-279: Increase the partial progress of retaining size calculations
GH-254: The brand effect of the updater.
Python stack trace
HeapViewer - Logical values added Instant, Attributes$Name, FDBigInteger, java.lang.module
HeapViewer - Logical value of class java.util - Collection now displays the number of elements
Gradle’s application identifier
Updated application identifier for JDK tools
API changes.
GH-282: Add generics to the public API of the org.graalvm.visualvm.lib.jfluid.heap package.
GH-283: Added method to obtain Heap from instance.
Bug fixed.
GH-127: G1GC’s maximum heap is incorrect
GH-257: "Failed to open snapshot." Due to incomplete reading of compressed data
GH-263: Reserved size calculated as negative
GH-268: Detect whether VisualVM is running on Eclipse OpenJ9
GH-272: No progress bar when calculating references
GH-273: NPE: Unable to call "java.lang.management.MemoryMXBean.gc()"
GH-274: Logical value: '...' is added to the complete string
GH-276: Missing known blocking method
GH-277: Incorrect horizontal scrolling
GH-278: NPE at LongBuffer.startReading().
GH-280: Incorrect background color selection on MacOS
HeapViewer--The logical values of PythonModule, SourceImpl$Key, InetSocketAddress, and BigDecimal are fixed.
Memory Sampler--Improved refresh function under reload
Improved detection of IntelliJ applications
Huajun editor recommends:
VisualVM is a software that is completely fool-proof and super simple to operate. I also recommend it.JUDE,jarfix,Apache Tomcat 9,FreeJava,WinPackDownload and use related software.


Useful
Useful
Useful