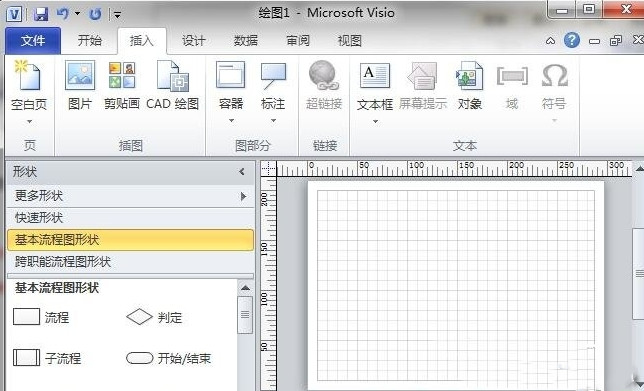
The official version of the drawing software Visio is a powerful graphics plan production software. The official version of the drawing software Visio has data-driven dynamic visualization tools and templates, powerful process management and advanced Web
Sharing function helps users draw charts easily. Through the drawing software Visio, users can draw flow charts, architecture diagrams, network diagrams, schedules and other diagrams to improve office efficiency.

Introduction to the functions of drawing software Visio
1. Universal business processes, easily collaborate on process design and use ready-made templates that comply with industry standards (BPM, EPC, Six Sigma, etc.). Share process models across your organization via a browser and benefit from improved visibility and compliance.
1) Efficiently define processes using built-in templates and selected standard annotations (either BPMN 2.0 defines BPMN tooltips or EPC defines EPC
tooltip) design process. Preconfigured validation rules check models against best practices and improve model accuracy.
2) Collaboratively create process models and engage the entire team in process optimization efforts using familiar co-authoring and collaboration tools. Via Skype for Business
Discuss the process model with stakeholders. Easily add annotations, work together on models, or annotate with a pen or finger.
3) Improve process visibility and compliance by incorporating information such as cost or risk levels directly on the process map, or linking strategy diagrams to process steps. Share data-linked process maps across your organization to increase transparency and compliance, keeping everyone up to date on the latest processes
KPI.
2. Actual operational insights, efficiently communicated by combining real-time data based on actual processes and plans. Easily share a unified version helps everyone stay on the same page.
1) Realize the practicality of diagrams through data links, quickly overlay data on IT networks, manufacturing plants or complex processes, about Visio
Tooltips for supported data sources Get operational insights in the most meaningful way. Charts and data visualization content are automatically updated when the underlying data is refreshed.
2) Easily customize visualizations to combine data patterns the way you want. Choose from default data graphics of icons, colors, and text, or configure Visio
Smart Shapes Easily create your own visual content.
3. Easily draw advanced diagrams and use ready-made shapes and templates to create flow charts, network diagrams, organizational charts, floor plans, engineering design drawings, etc. Take advantage of familiar Office
Experience increased productivity and create advanced diagrams more easily.
1)Create anything visually with ready-made templates and 250,000 shapes in the Visio ecosystem to easily transform your work into professional diagrams that meet industry standards.
2) Easy to get started, with the familiar Office experience, you can easily perform common flow chart drawing activities. Use a pen or your finger to sketch out ideas, or get tips from pre-made starter diagrams.
3) Easily collaborate on diagrams and collaborate the way you want. Multiple people collaborate on the same diagram at the same time using Skype for Business
Chat or quickly add notes using your pen or finger.
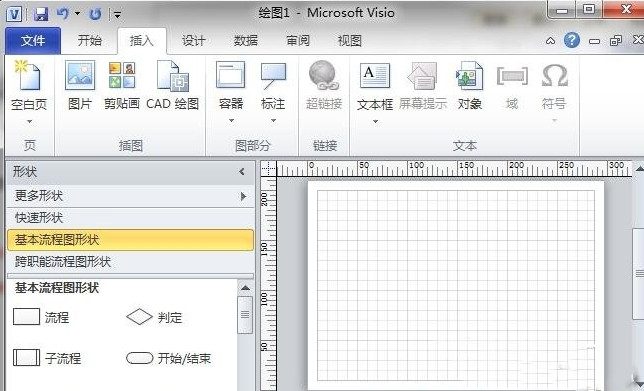
Features of drawing software visio software
Exchange information
Using Visio to express through diagrams can have the greatest impact on users, which cannot be achieved with words and numbers alone. Works with anyone (even those without Visio installed)
of users) share professional-looking Office Visio 2018 diagrams.
Customized
Office Visio can be extended programmatically or integrated with other applications
2018, thereby meeting industry-specific circumstances or unique organizational requirements. You can develop your own custom solutions and shapes, or use solutions and shapes provided by Visio solution providers.
Standard chart
Using existing data, you can generate many kinds of Visio standard diagrams, including organizational charts, schedules, calendars, and Gantt charts. However, the new and enhanced data capabilities discussed in this article are only available in
Available in Office Visio Professional 2018 but not in Office Visio Standard 2018.
Help file
The built-in help file Office Visio 2018 facilitates IT and business professionals to visually process, analyze and communicate complex information, systems and processes. Use professional-looking
Office Visio 2018 diagrams can promote understanding of systems and processes, gain insights into complex information and use this knowledge to make better business decisions.
Analyze information
Using Office Visio Professional
In 2018, complex information can be viewed visually to identify key trends, anomalies, and details. Gain deeper understanding of your business data and get more out of Office by analyzing, viewing details, and creating multiple views of your business data.
Features of Visio 2018. Easily identify critical issues, track trends, and flag anomalies using a rich library of icons and flags.
Alternative tools
Although Visio is one of the most commonly used software for drawing flow charts, it also has its own shortcomings. Therefore, it is a wise choice to choose an appropriate alternative tool based on the actual situation. Alternative tools for visio mainly include Axure and Mindjet
MindManager, Photoshop, OmniGraffle and ProcessOn, etc. Among them, ProcessOn is the highest-rated flowchart tool, as long as you have a browser (IE9 or above).
Drawing software visio update log
1. Sweep the bug out and carry it out to the end
2. The most stable version ever
Huajun Software Park provides you with the download of Microsoft Visio Installation Assistant. There is no bundling for online installation, so please feel free to use it.
Huajun editor recommends:
The drawing software Visio, Jinding, .NET, Cloud Machine Manager, etc. are all very good software. Welcome to our website to download and experience!

