DebugView provides a simple VC debugging solution. You can monitor the running data on the computer through the DebugView software, display the VC process service on the software, and view the current execution status of debug on the list. DebugView allows you to extract process error data into log text and edit fault information on the log, which is helpful for adjusting VC connections and VC startup solutions;
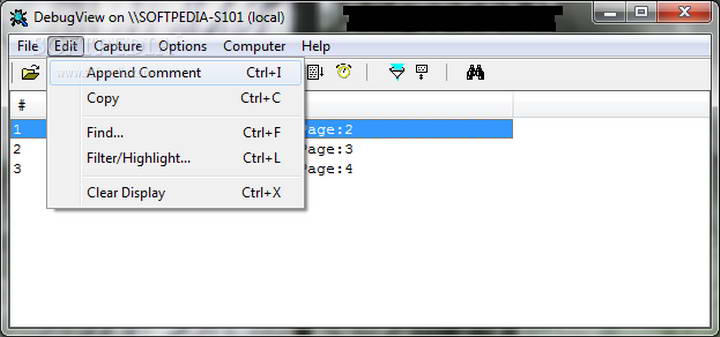
DebugView mainly provides five menu items for debugging VC, supporting several modules such as file, editing, monitoring, selection, and computer. You can find VC objects on the monitoring menu, and you can also find debugging items on the computer menu. There are many functions. Friends who need it can download and try it!
debugview software functions
1. DebugView supports Windows XPSP2. DebugView currently captures kernel mode debugging output in Windows XPSP2.
2. More prominent and more prominent filters.
3. Log file wrapping: A new log file option starts wrapping when the log file in the Chinese version of DebugView reaches the specified size limit.
4. More highlight filters: There are currently 10 highlight filters in DebugView
5. Insert comment: a new menu item, you can insert comment output
6. When the special debugging output string DBGVIEWCLEEAR is seen in DebugView, the clear output
debugview software features
1. DebugView to obtain VC data through compatible computer systems
2. Data on server operation errors can be extracted
3. Supports recording the resolved problems in the log
4. You can also transfer the fault data to another location
5. Support win32 system monitoring and switch in the monitoring interface
6. Support monitoring event customization and view monitored items
7. The VC startup time can also be displayed on the list.
8. Support adding an additional comment to VC
9. The monitoring solutions provided by debugview are very simple.
10. When starting, you need to click aggregate to start monitoring.
DebugView usage tips
Use debugview, open debugview, run your debug version program, and you can locate a certain line of the source file. You can use OutputDebugString to view the output in the VC source code in this tool. It is very practical for VC debugging code and does not require you to use Messagebox to debug step by step. And it's easy to operate, making it easier to find errors.
DbgView interface and monitoring method

Click "Connect Local"
After opening the software, select the monitoring host in the top toolbar. First look at connecting to the local machine for debugging, click "Connect Local".

Toolbar
On this toolbar, mainly look at a few icons
Toolbar On this toolbar, we mainly look at a few icons
 This button indicates whether to enable the capture service
 This button indicates whether to capture the Debug information of the system kernel.
 This button indicates whether to capture general Win32 applications, which is equivalent to the Debug information of our application.
Note: Only the output Debug information where the method in WinDebug is called can be captured by DebugView.
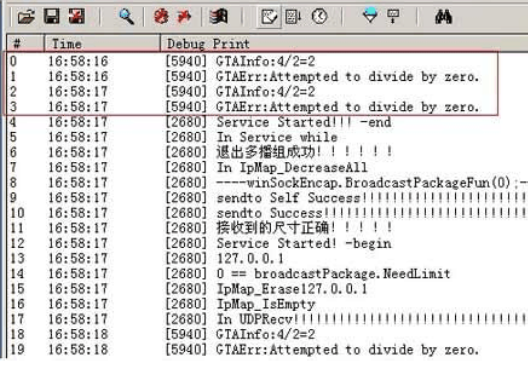
Let’s take a look at the captured application information:
will open
 Remove the cross between the two buttons, and you will see that DebugView may output some information.
As shown below:

These are Debug information output by applications in the system calling WinAPI. But only the red part is the information output by our Demo.
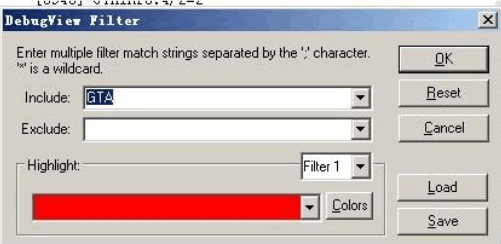
At this point we can create a new filter and only view the information we want to see.
After opening we see the picture below

In Include and Exclude, strings indicating that the content of Debug Print "includes" and "does not contain" respectively.
For example, enter in include: GTA

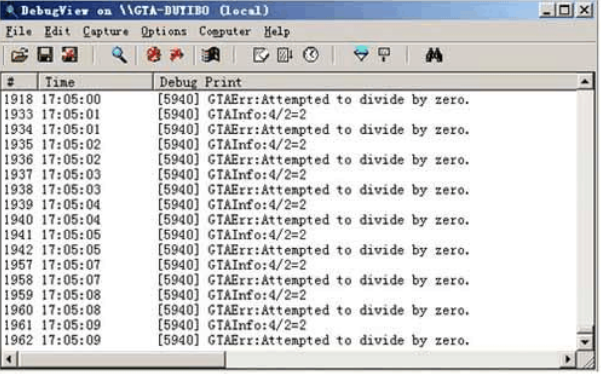
After clicking OK

DebugView will only display Debug information starting with GTA. Therefore, when writing a program, for the convenience of monitoring, we can classify the Debug information, constrain it with different prefixes or flags, and unify the Debug output format to facilitate the elimination and capture of system exceptions and other situations in the future.
 The number of records displayed on the surface of this button.
DebugView update log:
1.Fix some bugs
2. Optimized some functions
Huajun editor recommends:
After official continuous improvements, DebugView can meet all your needs. Come download and experience it. Of course, this site also carefully prepares ComMaster, SiSoftware Sandra, and .NET for you.


