-
Graphpad Prism scientific research drawing tool
- Size: 153.86M
- Language: Simplified Chinese
- Category: image processing
- System: WinAll


The official version of Graphpad Prism scientific research drawing tool is an excellent statistical drawing software that integrates biostatistics, curve fitting, and scientific research drawing. It is specially designed for scientific researchers. If you need to perform scientific research drawing, please use this free Graphpad Prism.
Basic introduction to Graphpad Prism scientific research drawing tool
Graphpad Prism is an excellent statistical drawing software that integrates biostatistics, curve fitting, and scientific research drawing. The software is specially designed for scientific researchers and can easily perform statistical analysis and draw statistical graphs. It has been widely used by world-renowned universities, scientific research institutions, medical centers and pharmaceutical companies. Graphpad Prism has the characteristics of practical functions and convenient operation. It has been loved by many users since its launch. The software integrates biostatistics, curve fitting and scientific drawing, which can help medical personnel easily create professional medical tables.
Graphpad Prism prism scientific research drawing tool software science popularization
Nonlinear regression is an important tool for analyzing data, but it is often more difficult than it needs to be. No other program makes curve fitting as easy as Prism. In fact, you can usually fit the curve in one step. Just select an equation from an extensive list of commonly used equations (or enter your own) and Prism does the rest automatically – fitting the curve, displaying the results in tabular form, plotting the curve on the curve graph, and interpolating the unknown values. Place data from multiple datasets side by side on organized data tables, and Prism can bring it all together at once. You can fit the same model to each data set separately, use global nonlinear regression to share parameter values between data sets, or fit different models to different data sets.
Although the sparrow is small and has all the essentials, Prism also provides you with many advanced accessory options. It can report confidence intervals for best-fit parameters as asymmetric ranges (P-value similarity method), which are much more precise than the usual symmetric intervals. It can also automatically interpolate unknown values in the standard curve (i.e. analyze RIA data), compare the fits of two equations using the F-test or the Akaike Information Criterion (AIC), plot residuals, identify outliers, differentially weight data points, test residuals for normality, and more.
Graphpad Prism scientific research drawing tool software functions
Data organization:
Using the concept of structured and formatted data tables, users need to select the corresponding data table format according to the type of chart or analysis to be created (such as XY chart, histogram, survival curve, etc.).
This design makes the data organized clearly, directly corresponds to the grouping and repeated design of experiments, and lays a solid foundation for subsequent statistical analysis and graphing.
Statistical analysis:
Rich built-in statistical analysis methods, including t test, analysis of variance, non-parametric test, linear regression, logistic regression, survival analysis, etc.
The software can automatically calculate statistics, P values, confidence intervals, etc., and generate statistical result tables and charts that comply with specifications.
Guide users to select appropriate testing methods, avoid misuse of statistics, and automatically interpret results.
Chart drawing:
Provides a large number of highly customizable scientific research chart templates, such as bar charts, line charts, scatter plots, box plots, survival curve charts, etc.
Users can customize various details of the picture, such as coordinate axes, titles, legends, scale labels, etc., to obtain beautiful statistical charts.
Supports image output in multiple formats, including high-resolution TIF format and EPS format, to meet various needs for publishing articles.
Results integration and output:
Project files contain all data tables, analysis results, charts, and notes to facilitate project management and collaboration.
Supports arranging multiple charts, result tables, and text annotations on one or more pages to form a complete chart result display page.
You can export single or multiple charts as high-resolution image files, or export the entire layout as PDF.
Features of Graphpad Prism scientific research drawing tool
Intuitive and easy to use:
The interface is friendly, no programming knowledge is required, and the learning threshold is lowered.
The toolbar buttons are concise and clear, with one-click operation, including all drawing and analysis functions.
Statistical rigor:
Rich built-in statistical analysis methods automatically generate statistical results that comply with specifications.
When performing statistical analysis, the software guides users to select appropriate test methods to avoid misuse of statistics.
Beautiful chart:
Provides a large number of highly customizable scientific research chart templates and outputs publication-grade images.
Users can choose the most suitable chart type according to their needs to show the relationships and trends of data.
Linkage of data and charts:
After modifying the data, the chart will automatically update to avoid duplication of work.
This linkage allows users to analyze and visualize data more efficiently.
Good compatibility:
Supports Windows and Mac operating systems to meet the needs of different users.
Supports multiple data export formats to facilitate data interaction and collaboration with other software (such as Word, PPT).
Graphpad Prism scientific research drawing tool installation steps
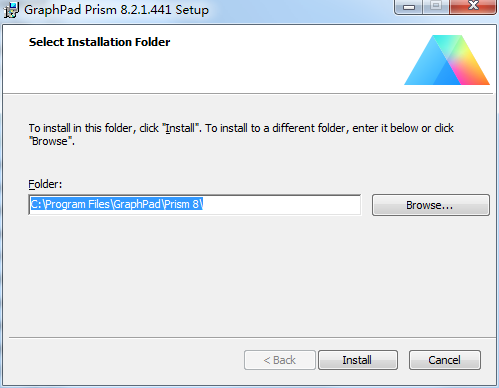
1. Download the compressed package of this software in Huajun Software Park. After decompression, double-click the exe file to enter the installation interface. Click browse to modify the default installation location on the C drive. It is recommended that you choose to install on the D drive, and then click install
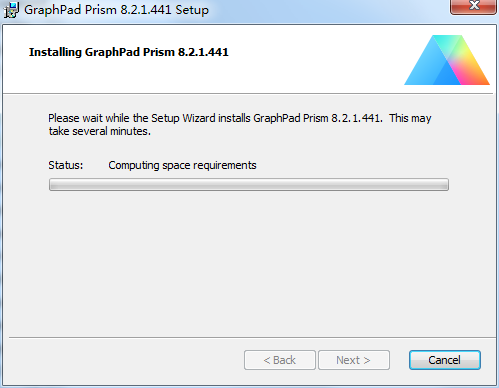
2. The software is being installed, we are waiting patiently
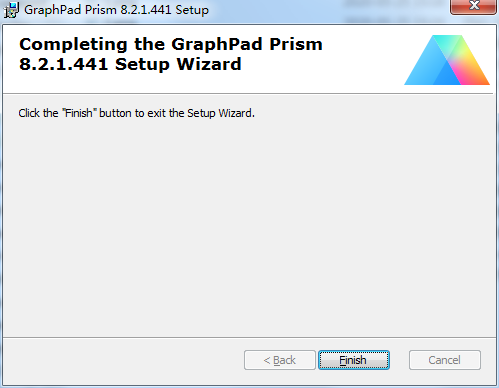
3. The software is installed successfully, click finish.
How to use Graphpad Prism scientific research drawing tool
1. Data entry
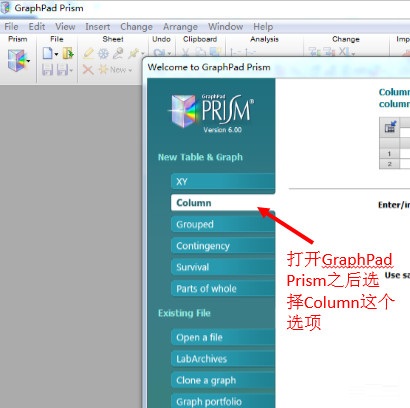
After opening the GraphPad Prism software, the software will ask the operator to select the data input type. At this time, pay attention to selecting the "Column" option. As shown in Figure 2:
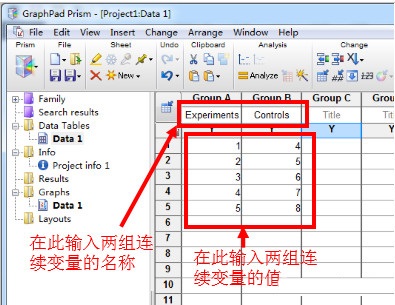
After that, enter the values of the two sets of variables respectively. As shown in Figure 3, the experimental group has a total of 5 samples, and the detection values are 1, 2, 3, 4 and 5 respectively; the control group also has 5 samples, which are 4, 5, 6, 7 and 8 respectively. You can also identify the data in the table header, namely Experiments and Controls. If not identified here, the default group names are Dataset A and Dataset B.
2. Operation of results
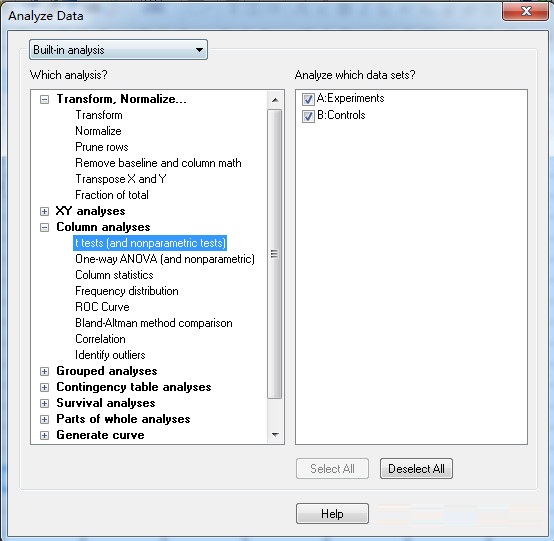
After entering the results, click Analyze in the menu bar, and the interface shown in Figure 4 will appear. Note that "t tests (and nonparametric tests)" must be selected on the left.
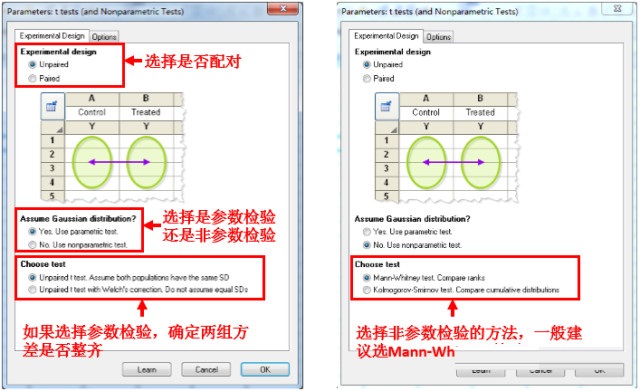
Click OK in Figure 4 to enter the interface shown in Figure 5. In this interface, the software requires the author to choose whether to pair (Paired or Unpaired) and decide whether to choose a parametric test or a non-parametric test. The so-called parametric test refers to the paired t test or independent samples t test, while the non-parametric test refers to the Mann-Whitney U test or the paired Wilcoxon test. If you choose parametric testing (by default, both sets of data are normally distributed), the software will let the operator choose whether the variances are equal.
If the variances are equal, the software will choose the t test. If the variances are not equal, the software recommends the Welch method. One thing that needs to be explained is that if the two sets of data are both normal distributions but have uneven variances, the corrected t test should be used. Currently, there are three main corrected t test methods: Cochran & Cox method, Satterthwait method and Welch method. GraphPad Prism only supports Welch's method.
If the two sets of data are not normally distributed, non-parametric tests should be used. The two non-parametric options are the Mann-Whitney U test and the Kolmogorov-Smirnov test. Generally, the Mann-Whitney U test is chosen.
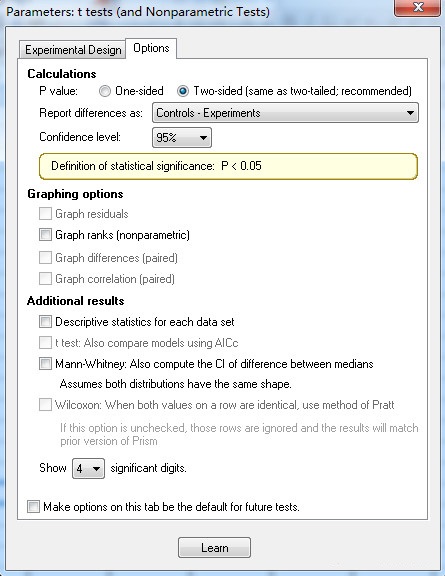
In addition to Experimental Design, you can also modify the contents of the Optional options. As shown in Figure 6. It is generally recommended to select the "Discreptive statistics for each data set" (display the mean, median, standard deviation, rank sum, etc. of each set of data) option. In the P value section, the system defaults to a two-tailed test, and it is generally recommended not to change it.
After selecting all options, click OK to proceed with the calculation.
3. Interpretation of results
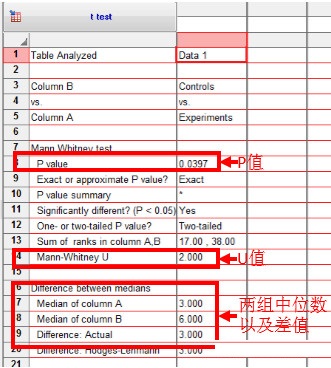
The results are generally divided into two parts. One is whether the difference is statistically significant; the other is how big the difference is. If the researcher chooses the Mann-Whitney U test, the results shown in Figure 7 can be obtained.
The interpretation of the parameter analysis results is similar to this, except that there is an additional F test to compare variances, that is, whether the variances are equal. It is generally believed that only when the P value is greater than 0.10 can the two sets of data have the same variance (note: it is "greater than", not "less than"! It is "0.10", not "0.05"!!!!).
4. Test whether the data is normally distributed
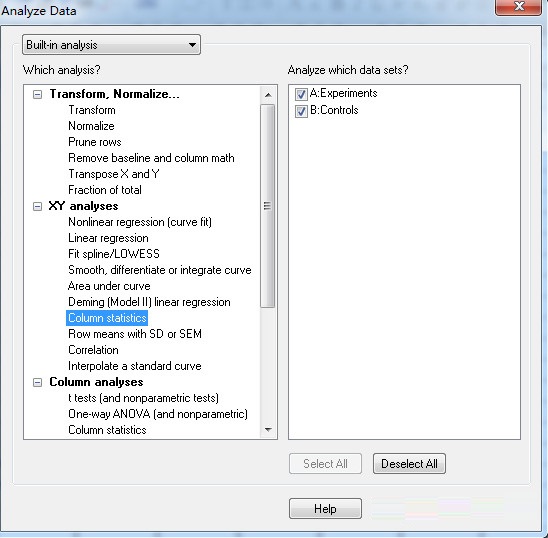
Some readers may ask whether GraphPad Prism can determine whether the data is normally distributed. In fact, it is possible to perform a normal distribution test. Taking the above two sets of data as an example, first click Analyze, and then select Column statistics under XY Analysis. As shown in Figure 8:
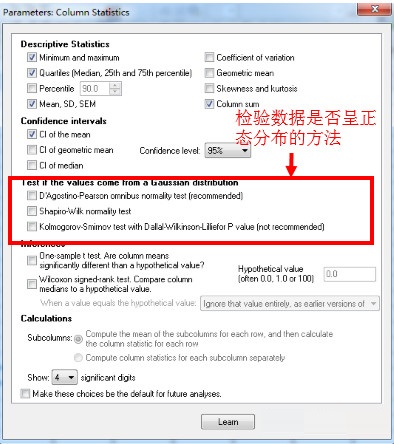
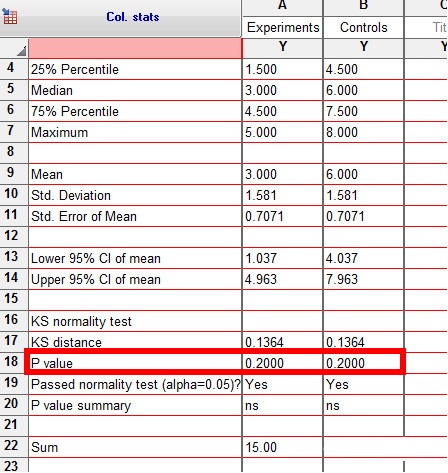
As shown in Figure 9, GraphPad Prism provides three methods to test whether the data is normally distributed: D’Agootino-Pearson method, Kolmogorov-Smirnov method and Shapiro-Wilk method. For the same data, the calculation results of the three methods are similar. Although GraphPad Prism does not recommend using the Kolmogorov-Smirnov method, according to the author’s experience, when publishing papers internationally, the results of the Kolmogorov-Smirnov method are often used. This may be because when the sample size is too small, the Shapiro-Wilk method and the D’Agootino-Pearson method cannot give test results. Of course, you can also choose all three methods to comprehensively determine whether the data is normally distributed.
After selecting the statistical method and clicking OK, you can get the results of the normality test, as shown in Figure 10. What needs special explanation is: in the normal test, it is generally considered that the data is normally distributed only when P is greater than 0.10 (note: it is "greater than", not "less than"! It is 0.10, not "0.05"!!!!). In this case, the P values of both sets of data are 0.20, so both sets of data can be considered to be normally distributed.
Graphpad Prism scientific research drawing tool FAQ
Use Graphpad Prism scientific research drawing tool official version software to draw scatter plots and linear analysis?
Open the official version of Graphpad Prism scientific research drawing tool, select the first column on the right side of Y, and click create.
Enter the group in the corresponding blank spaces below X and Group A, and enter the data below X and Y.
Click Data1 under Graphs to output the picture, select the scatter plot, and click OK.
Click Analyze and click Linear regression.
Click OK, the following dialog box will pop up, continue to click OK, and the fitted straight line graph will appear.
Continue to click analyze to start correlation analysis. Change linear regression to correlation.
Click Ok, the following dialog box will pop up, continue to click ok. In the results, you can see the Pearson r correlation of the scatter plot and the P value size.
Comparison of similar software
CorelDraw2020The official version is a new vector graphics production software carefully created by Corel. cdr2020 is convenient and practical, allowing you to more easily perform image processing operations such as vector illustrations, page layout, picture editing and design. CorelDraw2020 software has powerful functions and can bring users a new LiveSketch vector drawing experience.
Photoshop2020The official version is a new graphics processing software from Adobe. The ps2020 software has powerful functions and can perfectly meet the design needs of amateur photographers, photography enthusiasts and business users. The official version of Photoshop 2020 is simple to operate, and users can easily modify and process photos without mastering too much professional knowledge.
Graphpad Prism scientific research drawing tool update log
1: Optimized performance
2: We are serious about solving bug problems
Huajun editor recommends:
The official version of Graphpad Prism scientific research drawing tool integrates biostatistics, curve fitting, and scientific research drawing. The editor has also prepared for youCorel Painter 2019
Version: 9.3.1.471 | Update time: 2025-12-01
Similar recommendations


Latest updates


How to delete history in Video Pioneer? -How to delete history records by Video Pioneer
How to set the skin for Video Pioneer? -How to set skin for Video Pioneer
How to upgrade software in 360 Software Manager? -How to upgrade software in 360 Software Manager
How to draw a lottery in 360 Software Butler - How to draw a lottery in 360 Software Butler
Graphpad Prism Scientific Drawing Tool Review
-
1st floor Huajun netizen 2020-05-18 09:41:32Graphpad Prism scientific research drawing tool software is very easy to use, downloads quickly and is very convenient!
-
2nd floor Huajun netizen 2020-08-29 05:57:55The overall feeling of Graphpad Prism scientific research drawing tool is good, I am quite satisfied, the installation and operation are smooth! It went very smoothly following the installation step-by-step guide!
-
3rd floor Huajun netizen 2018-11-05 13:17:38Graphpad Prism is a good scientific research drawing tool. It downloads very quickly. I give you a good review!
Recommended products


- Diablo game tool collection
- Group purchasing software collection area
- p2p seed search artifact download-P2P seed search artifact special topic
- adobe software encyclopedia - adobe full range of software downloads - adobe software downloads
- Safe Internet Encyclopedia
- Browser PC version download-browser download collection
- Diablo 3 game collection
- Anxin Quote Software
- Which Key Wizard software is better? Key Wizard software collection