Hot search terms: 360 Security Guard Office365 360 browser WPS Office iQiyi Huawei Cloud Market Tencent Cloud Store

Hot search terms: 360 Security Guard Office365 360 browser WPS Office iQiyi Huawei Cloud Market Tencent Cloud Store

science tools Storage: 856.71MB Time: 2022-04-18
Software introduction: Stata official version is a very excellent practical science statistics software. Stata official version is powerful, efficient and professional, and provides data analysis...
Recently, many friends have asked me how to use polylines to connect scattered points in Stata. Then I will introduce to you how to use polylines to connect scattered points in Stata. Friends in need, please come and take a look below. Content.
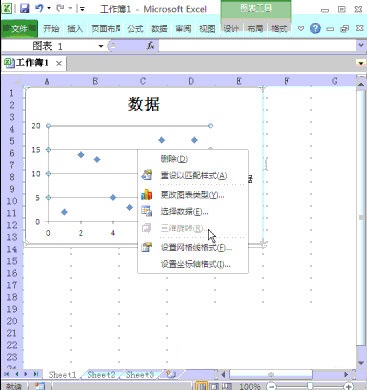
First, right-click on the chart area and change the chart type to Scatter with Smooth Line and Data Markers

After entering, just select the corresponding module.
Check the effect (OK)
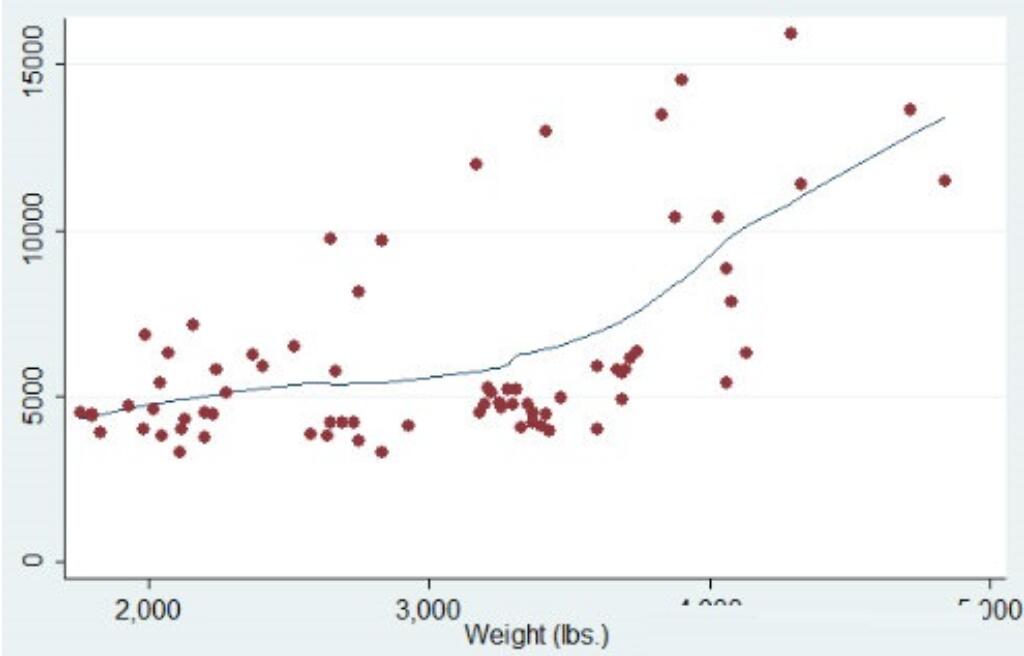
Or use the command twoway (scatter y x) (lfit y x)
"lfit" means "linear fit" (linear fitting), and the shape is a straight line. If you want to draw a quadratic regression curve on the scatter plot at the same time, directly change "lfit" to "qfit", (quadratic fitting) , the shape is a curve.

The above is the editor's introduction to Stata's method of connecting scattered points with polylines. Friends in need should not miss it.
 How to update google? -Google update method
 How to compress Bandizip to zip format - How to compress Bandizip to zip format
 How to decompress files with bandizip - How to decompress files with bandizip
 How to set the language in bandizip-How to set the language in bandizip
 CS1.6 pure version
 Eggman Party
 WPS Office 2023
 Minecraft PCL2 Launcher
 Homework help computer version
 SolidWorks2020
 Office 365
 WeGame
 Lightning simulator
 What to do if there is no sound after reinstalling the computer system - Driver Wizard Tutorial
 How to practice typing with Kingsoft Typing Guide - How to practice typing with Kingsoft Typing Guide
 How to upgrade the bootcamp driver? How to upgrade the bootcamp driver
 How to change QQ music skin? -QQ music skin change method
 Driver President Download-How to solve the problem when downloading driver software is very slow