Hot search terms: 360 Security Guard Office365 360 browser WPS Office iQiyi Huawei Cloud Market Tencent Cloud Store

Hot search terms: 360 Security Guard Office365 360 browser WPS Office iQiyi Huawei Cloud Market Tencent Cloud Store

programming tools Storage size: 27.50 MB Time: 2022-12-05
Software introduction: Python is a general-purpose computer programming language. Python is a very beneficial tool for programmers, allowing you...
Python is a powerful, easy-to-learn and use programming language that is widely used in many fields such as data science, machine learning, web development, and automated scripting. By caching calculation results or reusing already calculated values, you can improve performance by avoiding repeated calculations. Generators provide a way to create iterators that produce values only when needed, saving memory and improving performance. Next, let the editor of Huajun explain to you how to draw three-dimensional graphs in python and how to draw three-dimensional graphs in python!
first step
Open your Python editing tool such as IDLE, PyCharm, VSCode, Jupyter Notebook, etc.

Step 2
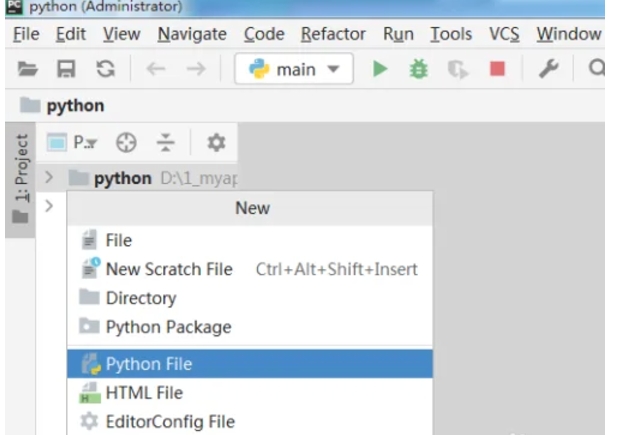
Create a new Python file in your editing tool, named 3d_plot.py for example.

Step 3
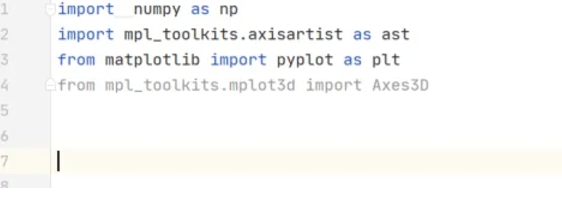
In the 3d_plot.py file, introduce the matplotlib.pyplot and mplot3d libraries.

Step 4
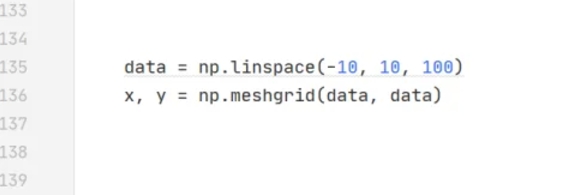
Define the data you want to plot on the 3D plot. This usually consists of three lists, one for x, y and z coordinates. If you want to plot a three-dimensional function, such as z = f(x, y), you need to generate grid data for x and y and calculate the corresponding z value.

Step 5
If your data is not generated by simple mathematical expressions, you have already defined your data in step four. Otherwise, you can define a 3D function to calculate z-values in this step. But in this example, we already defined Z in step four. Create a graphics object and a 3D axis object, and then use the plot_surface (for grid data) or scatter (for scatter data) method to draw the 3D plot.

Step 6
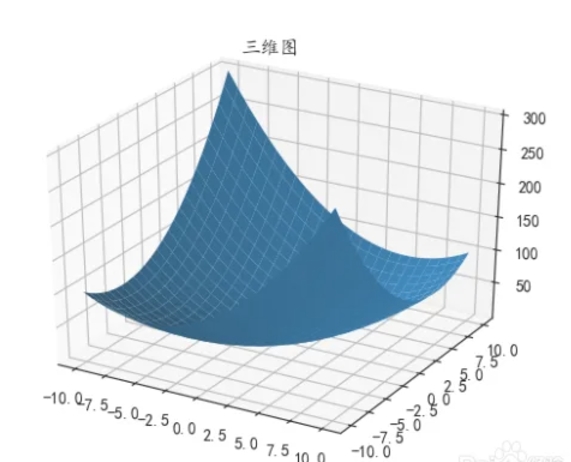
In your editing tool, click the [Run] button or use the corresponding shortcut key to run the 3d_plot.py file. The program will execute and display a window containing a 3D plot.


The above is how to draw three-dimensional graphs in python and the method of drawing three-dimensional graphs in python compiled by Huajun editor for you. I hope it can help you!
 How to customize symbols in coreldraw - How to customize symbols in coreldraw
 How does coreldraw automatically adjust bitmaps - How does coreldraw automatically adjust bitmaps
 How to print files in coreldraw - How to print files in coreldraw
 How to embed bitmaps in coreldraw - How to embed bitmaps in coreldraw
 How to draw a closed arc in coreldraw - How to draw a closed arc in coreldraw
 Sohu video player
 WPS Office
 Tencent Video
 Lightning simulator
 MuMu emulator
 iQiyi
iQiyi
 Eggman Party
 WPS Office 2023
 Minecraft PCL2 Launcher
 What to do if there is no sound after reinstalling the computer system - Driver Wizard Tutorial
 How to switch accounts in WPS Office 2019-How to switch accounts in WPS Office 2019
 How to clear the cache of Google Chrome - How to clear the cache of Google Chrome
 How to practice typing with Kingsoft Typing Guide - How to practice typing with Kingsoft Typing Guide
 How to upgrade the bootcamp driver? How to upgrade the bootcamp driver