PyCharm is a powerful Python integrated development environment (IDE) launched by JetBrains. PyCharm provides a series of advanced features designed to help Python developers improve coding efficiency, simplify the development process, and ensure code quality and maintainability. Next, let the editor of Huajun explain to you how to debug the program in the console interface of pycharm!
first step
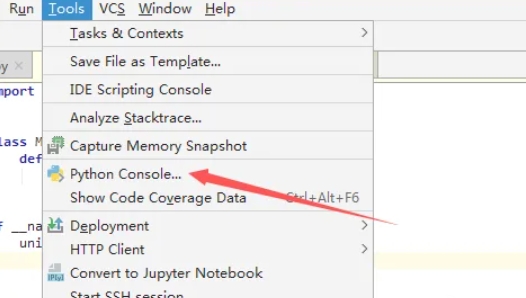
First, start PyCharm and open your project. Then, find and click the "Tools" menu in the top menu bar.

Step 2
In the drop-down list of the "Tools" menu, find and click the "Python Console" option. This will open a Python command window where you can enter and execute Python code.

Step 3
In PyCharm's code editor, use your mouse or keyboard shortcuts to select the piece of code you want to debug. Make sure that the selected code is the portion of code that you want to execute and debug in isolation.

Step 4
After selecting the code, right-click on the selected code area. In the context menu that pops up, find and select the "Execute Selection in Console" option. This can also usually be performed via a shortcut key (such as Alt+Shift+E on Windows, Option+Shift+E on Mac).

Step 5
The selected code snippet will be copied to the Python console and executed. You can view the output of your code in the console window and perform further debugging and analysis as needed.

The above is the method of how to debug programs in the console interface of pycharm compiled by Huajun editor for you. I hope it can help you.


