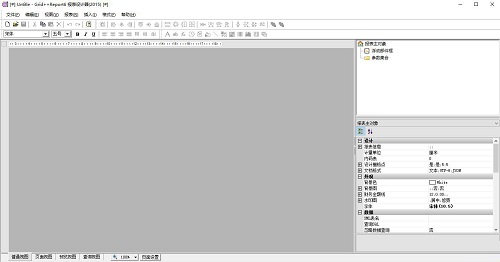
The official version of Grid++Report report tool is a report design and development software that is often used by programming developers. The computer version of Grid++Report report tool is used to develop desktop software and WEB software report and printing systems based on B/S architecture. The Grid++Report reporting tool can also support desktop development languages such as VB, VC, Delphi, CBuilder, etc., as well as network development languages such as ASP, ASP.NET, JSP, and PHP.
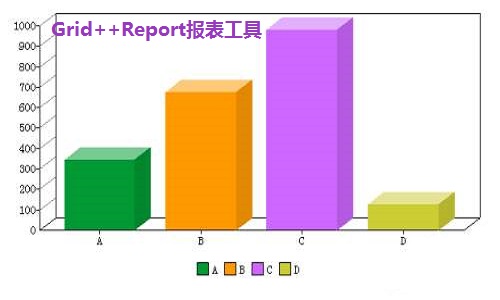
Grid++Report report tool software functions
1. Report engine object (GridppReport)
A COM object, an invisible component object. Define the template data of the report, store the report record data when generating the report, and process the data. Generate print pages, output print pages, etc. The core functions of report definition, generation and presentation are implemented on this object, and other report presentation controls depend on and are associated with the report engine object.
2. Report query display (GRDisplayViewer)
An ActiveX
controls. A report engine object must be associated when using it. The report data is displayed in a continuous non-paged manner, similar to the conventional table control, but the data display format is richer, providing end users with a complete data viewing operation. Report developers can provide interactive report query functions for report end users by responding to interactive events. For example, by responding to the double-click event of the summary report, the corresponding detailed report is opened to achieve penetrating query from the summary report to the detailed report.
3. Report printing viewer (GRPrintViewer)
An ActiveX
controls. A report engine object must be associated when using it. Display the report as a printout page to realize the print preview function of the report data. After the report is displayed, printing, data export, etc. can be performed. This control is the most commonly used display control after report generation. The product implements a default print preview interface, and report developers can implement a customized report print preview interface by using the report print monitor.
4. Report Designer (GRDesigner)
An ActiveX
controls. A report engine object must be associated when using it. It consists of three windows: one is the report layout window, where you can mainly set the size, position, display order, etc. of the report display elements. The second is the attribute editing window, where you can view and modify the attribute values of the selected object. The third is the object browsing window, which displays all report element objects. You can select report elements in this window. The component interface provides action methods to perform various design tasks. Report developers can provide an external operation interface to perform action methods and provide end users with a runtime custom report designer.
Grid++Report report tool software features
1. Can develop both desktop software (C/S) and WEB software (B/S)
2. Unique report query and display function
3. It is very convenient to develop dynamic reports
4. Report data sources are rich and support binding and non-binding
5. There are multiple adaptive strategies for paper when printing
6. It is very convenient to implement tabular reports
7. Defining freely arranged reports is as convenient as other report components
8. Special implementation of bill printing
9. Interaction with the user is possible when the report query is displayed
10. Widely applicable development tools
11. High operating performance
12. Easy to re-publish
Grid++Report report tool installation steps
1. Download the Grid++Report report tool from Huajun Software Park and extract it to the current folder. Click the Grid++Report6.5.exe application to enter the installation wizard interface, and then click Next.

2. Select the software installation location interface. Huajun editor recommends that users install it on the D drive, select the installation location and click Next.

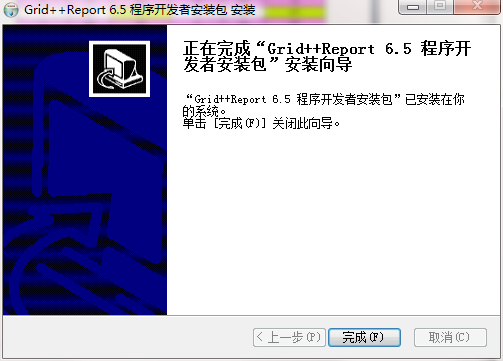
3. The installation of Grid++Report reporting tool is completed, click Finish.
How to use Grid++Report report tool
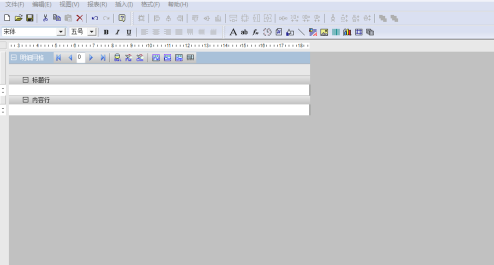
The first step is to open the Grid++Report report designer and insert a detailed grid into the new report, as shown in the following figure:
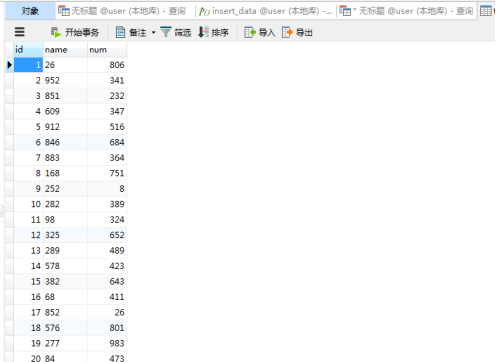
The second step is to open the MySQL client, create the database table t_nums, and then use the stored procedure to insert 1000 pieces of data, as shown in the following figure:
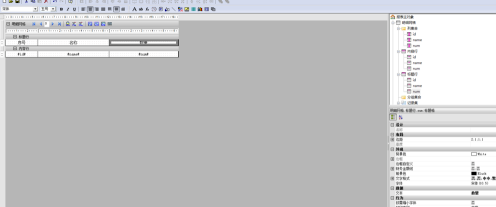
The third step is to automatically generate fields and columns in sequence, and then generate a report on the left, as shown in the figure below:
The fourth step is to save the file in grf format, then switch to preview view to view the report effect, as shown in the figure below:
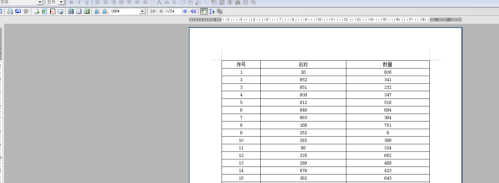
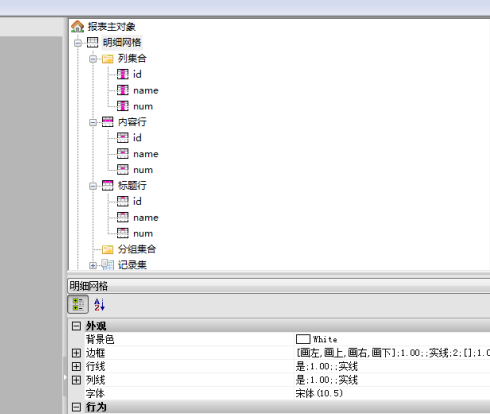
The fifth step is to find that 1000 records displayed in the fourth step need to be displayed on 24 pages. Select the detailed grid and change the number of columns in the printed column page to 2, as shown in the figure below:
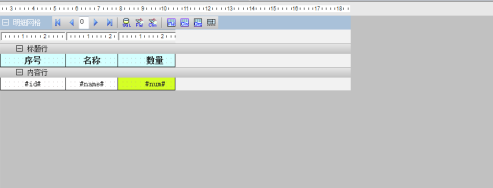
The sixth step is to adjust the width of the original report field column so that it displays the next two columns, and then check the report effect, as shown in the figure below:
Grid++Report report tool FAQ
Question: How to use Grid++Report to design a table with titles?
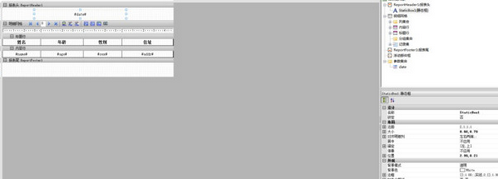
Answer: The first step is to open the Grid++Report report plug-in tool and create a new report header, detail grid and report footer.
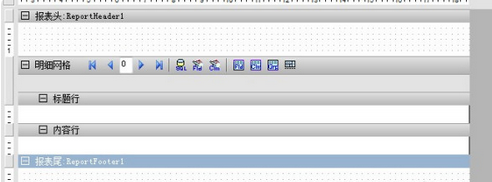
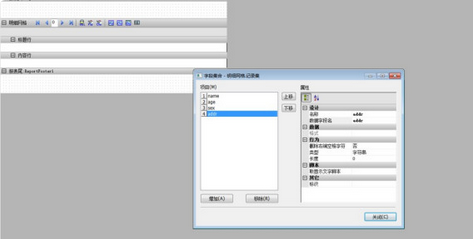
The second step is to select the detailed grid on the right, right-click the mouse to select the field set, and add four fields
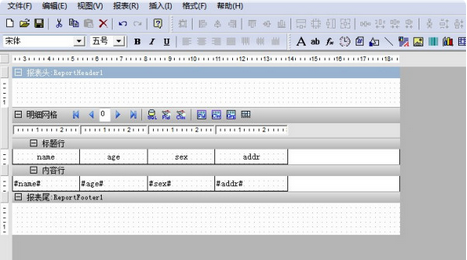
The third step is to select the detail grid again and click Automatically generate columns. At this time, the newly added fields will be displayed in the detail grid.
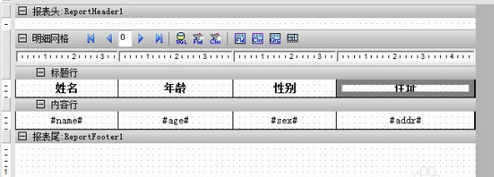
The fourth step is to adjust the width of the fields in the grid details and the header font style so that the content is displayed in the center
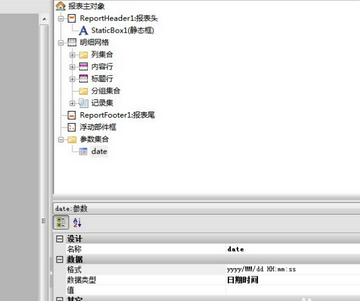
The fifth step is to select the parameter set, add a new parameter date, and set it to the date and time data type and format.
The sixth step is to add a static box to the report header and bind the date parameter date to the static box.
Q: How to uninstall Grid++Report reporting tool?
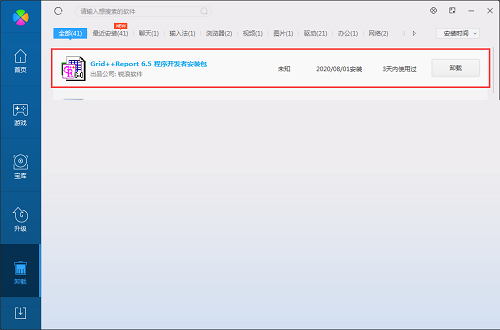
Answer: Method 1: Install and open the computer manager software, select the software management option, click the uninstall option, find the Grid++Report report tool in the list, and click uninstall
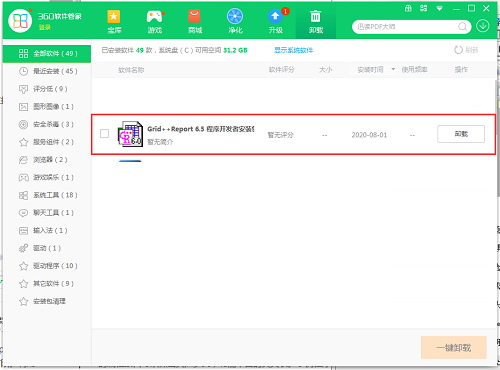
Method 2: Install and open 360 Software Manager, find the Grid++Report reporting tool in the list of uninstall options, and click to uninstall.
Comparison of similar software
Smart-Report reporting toolSupports conventional BI applications - report production (reports, graphics), analysis and information release; provides a powerful development environment and easy-to-maintain reports; the threshold for mastering this tool is relatively low and can be mastered through simple training; data security is unified Control; convenient integration with other business systems through open API interfaces.
Hua Bao Intelligent Reporting Tool (ReportAll)It is the most ideal report tool for developers. It has a brand-new design idea and is highly targeted for Chinese-style reports and many complex reports. It perfectly integrates "object placement" and "spreadsheet" report development tools. Generate report styles of any complexity using a rich and powerful combination of report objects.
Huajun editor recommends:
Grid++Report report tool is mainly used to develop desktop software and WEB software report and printing systems based on B/S architecture. This site also has similar software such as WebOffice webpage editing control, jQuery 1.9.1 official version, and Tarma QuickInstall. Welcome to click to download and experience it!


