Friends, do you know how to draw a Gantt chart in Microsoft Visio? Today I will explain Microsoft If you are interested in how to draw a Gantt chart in Visio, please come and take a look with the editor. I hope it can help you.
Step 1: First, we open the Microsoft Visio software on the computer, and you can see the [Schedule] template in the home page template category, as shown in the figure below.

Step 2: Then click [Schedule] in the template category. You can see the [Gantt Chart] option in the template, as shown in the figure below.
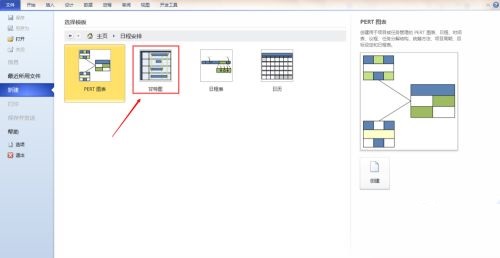
Step 3: Then click the [Gantt Chart] option to enter the Gantt chart drawing interface. First, the Gantt chart options window pops up, as shown in the figure below.
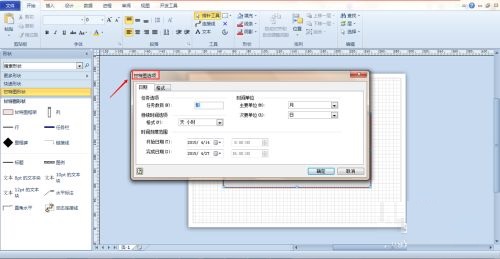
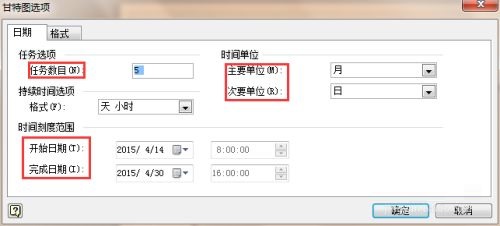
Step 4: Select the number of tasks, time unit, start time, end time and other options in the Gantt chart options window, as shown in the figure below.
Step 5: After completing the settings, click the [OK] button. At this time, a Gantt chart template is generated in the drawing panel, as shown in the figure below.
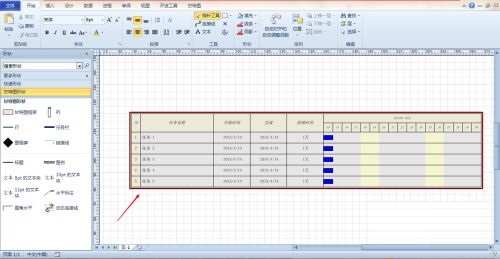
Step 6: Click on the cell of the generated Gantt chart template to edit the task name, start time, and completion time. After the editing is completed, the duration and Gantt chart effect will be automatically generated, as shown in the figure below.
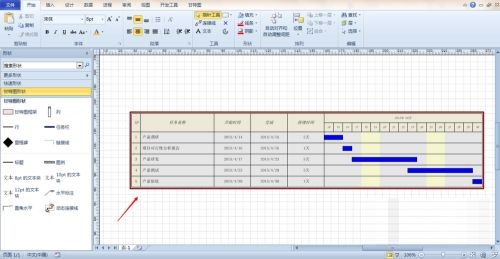
Step 7: Finally, you can save the drawn Gantt chart in JPEG format. After the above steps, the Gantt chart is completed, as shown in the figure below.

The above is the entire content of how to draw a Gantt chart in Microsoft Visio brought to you by the editor. I hope it can help you.


