Don’t you know how to use Stata to draw graphics with black and white background? If you don’t know how, come and learn how to draw black and white graphics with Stata. I hope that through this tutorial, you can better understand Stata.
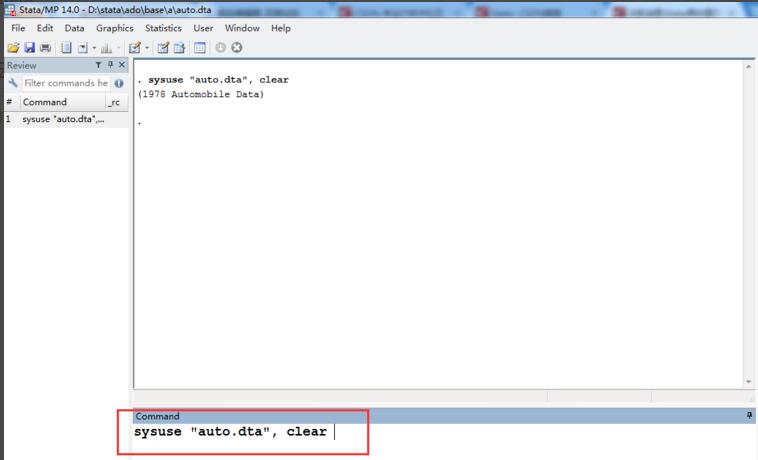
First open the Stata sample data set: sysuse "auto.dta", clear
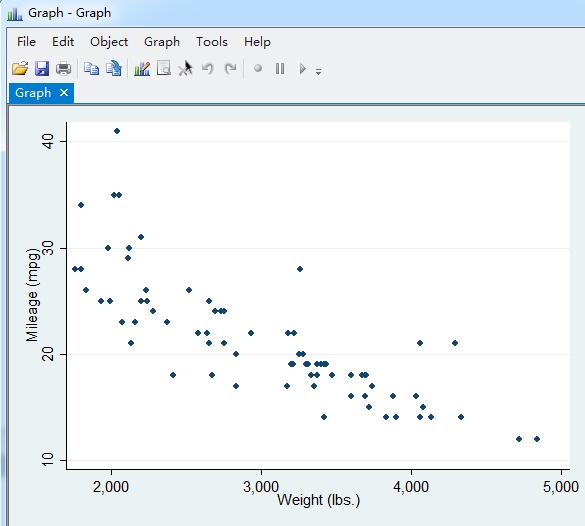
As shown in the figure, the graph drawn by default has a blue shading, which is highly recognizable and is also a unique style of Stata.
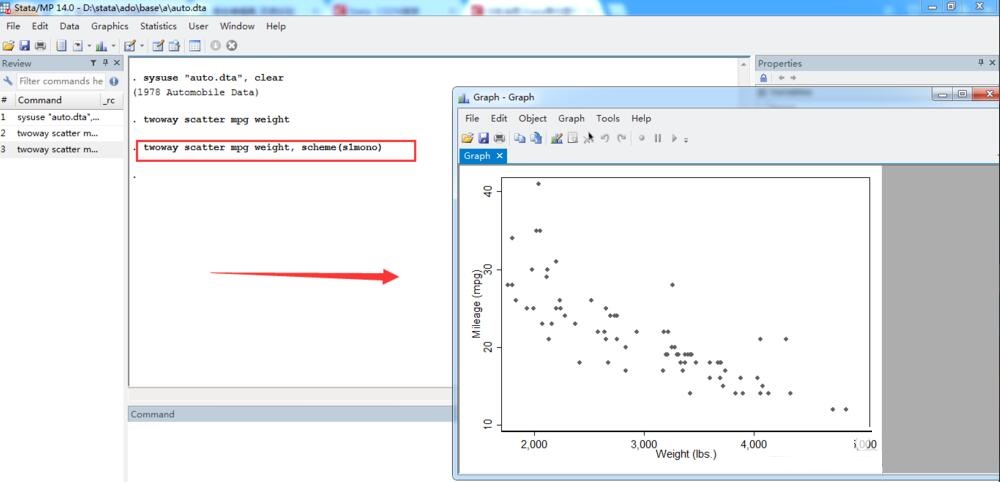
Next, we first use the black and white template s1mono officially provided by Stata for drawing: twoway scatter mpg weight, scheme (s1mono). We can see that the output effect has basically met our needs.
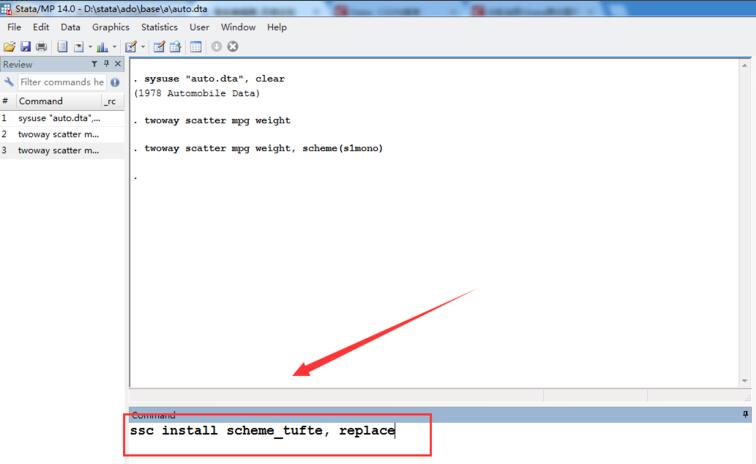
In addition to official templates, we can also use more powerful user templates. It is recommended that you use the tufte template. The installation command is: ssc install scheme_tufte, replace
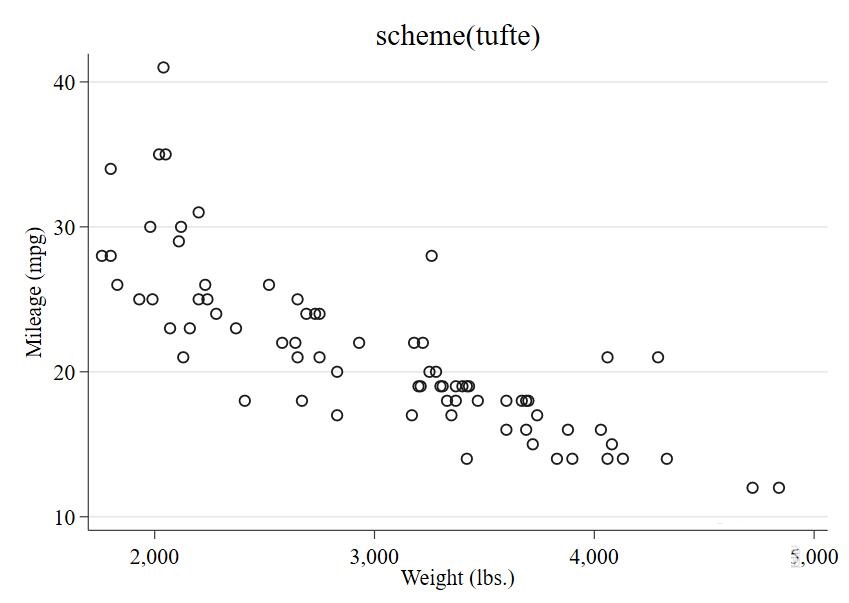
As shown in the figure, install and use the command: twoway scatter mpg weight, scheme(tufte), so that a black and white background graphic can be drawn.
The above is the method of drawing black and white background graphics in Stata shared by the editor. Friends in need can take a look.