How to draw the cumulative distribution function of samples in Stata - Stata introductory tutorial
Time: 2021-02-17Source: Huajun Software TutorialAuthor: Aotuman
How to use Stata to draw the cumulative distribution function of samples? Below, the author will bring you the operation method of Stata to draw the cumulative distribution function of samples. Friends in need can take a look. I hope it will be helpful to everyone.
First, open Stata (it is recommended that you try to use a higher version of Stata).

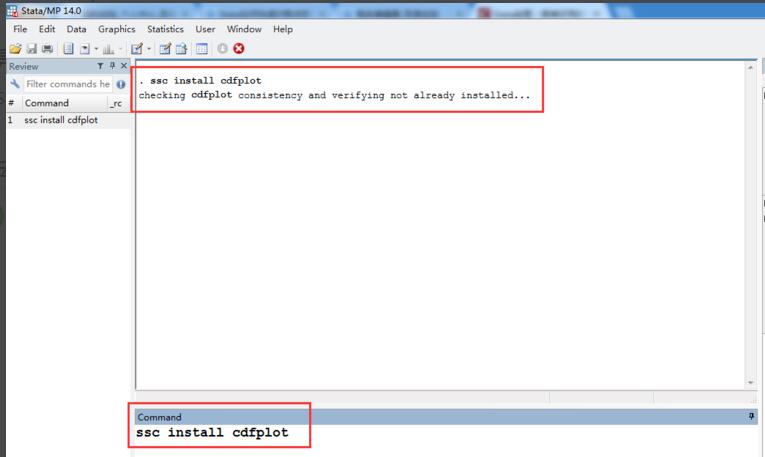
Enter: ssc install cdfplot in the command box to install this external command.
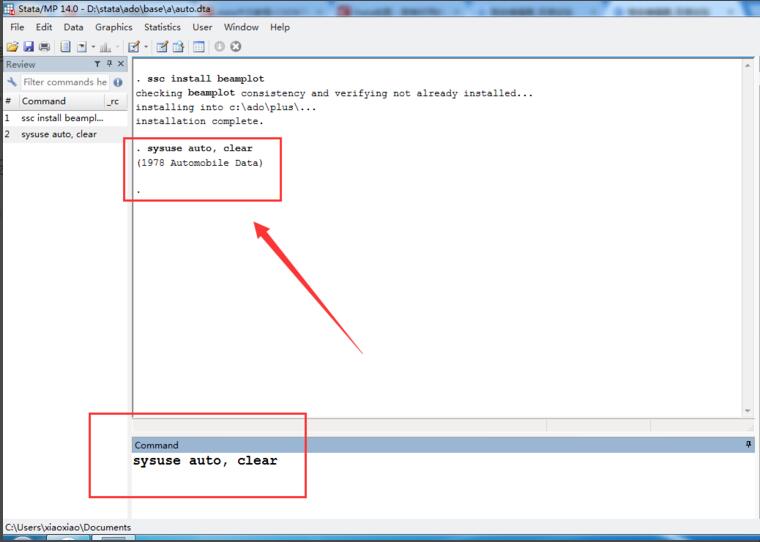
Import the sample data that comes with Stata. Type the command: sysuse auto, clear to open the 1978 car transaction data.
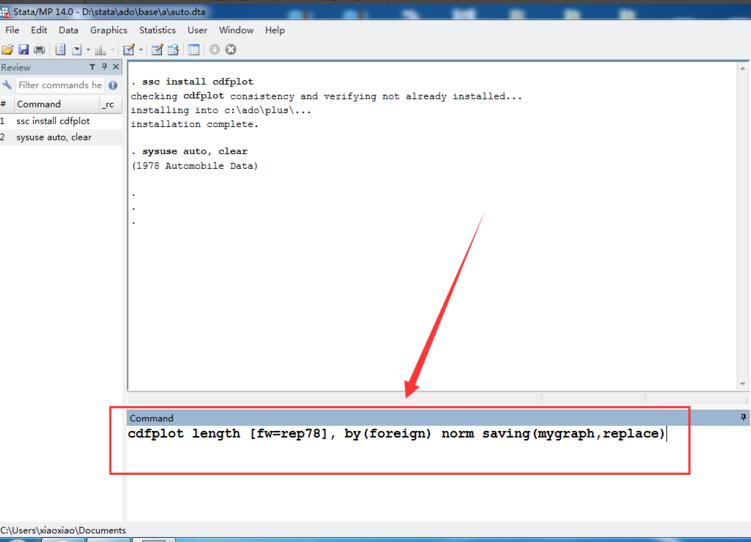
Specify a separate sample cumulative distribution function for the vehicle type values, grouped by vehicle length. The command is: cdfplot length [fw=rep78], by(foreign) norm saving(mygraph,replace)
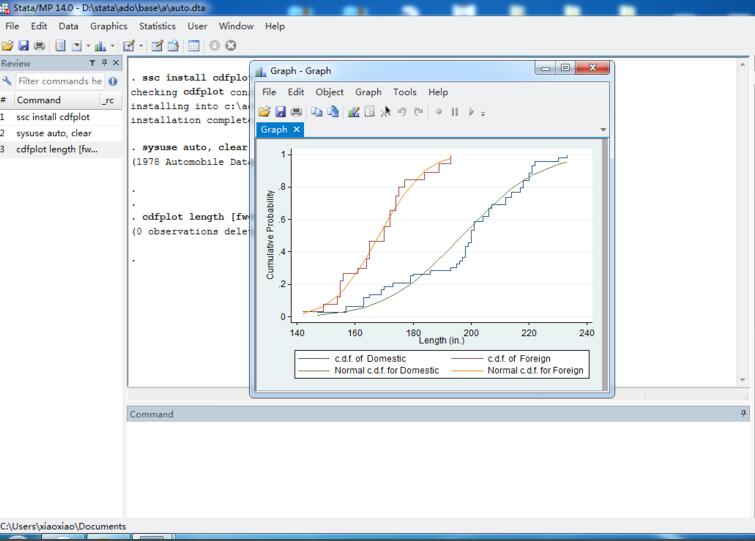
As shown in the figure, the sample cumulative distribution function is automatically generated after execution, and the statistical results are displayed intuitively.
The above is the operation method of drawing the sample cumulative distribution function of Stata brought by the author. Friends who don't know how to do it should hurry up and learn it.
Popular recommendations
-
WinQSB
Version: 2.0Size: 93MB
This 64-bit WinQSB installation package is designed for Windows 10 and Windows
11 system design, the biggest feature is that it can run directly without a virtual machine. Users can...
-
MathType
Version: 7.8.2Size: 39.13MB
MathType (mathematical formula editor) is developed by Design
A professional mathematical formula editing tool developed by Science Company. MathType function is...
-
MathType
Version: 7.8.2Size: 50MB
MathType is a professional mathematical formula editor that can be used with Office
Compatible with more than 700 programs such as word and Excel, it is convenient for users to edit math test papers,...
-
MathType Chinese version
Version: v6.9bSize: 9.87 MB
MathType is a powerful mathematical formula editor that can add complex mathematical formulas and symbols to various documents. It can be used to edit data...
-
MathType (mathematical formula editor)
Version: 7.8.2Size: 39.13MB
MathType formula editor is a powerful mathematical formula editor specially prepared for science students. MathType math formula editor is used to edit math test...