Some netizens said that they still don’t know how to calculate the intersection coordinates of the scatter plot curve in Excel. Below, the editor will share the detailed steps of calculating the intersection coordinates of the scatter plot curve in Excel. I hope it will be helpful to you.
1. Examples
1. When the elevator is running, there are current curves with different loads. The current value is the Y-axis, and the load-to-load ratio is the X-axis. When the elevator goes up, the current of 30%, 40%, 45%, 50%, and 60% of the load generates a curve. When the elevator goes down, a curve is generated. A curve is generated when the current of 30%, 40%, 45%, 50%, and 60% load is used. Then the two curves will have an intersection point, and the X-axis value of the intersection point needs to be calculated in the Excel cell. As shown in the figure: Calculate the x-axis value of the intersection point.
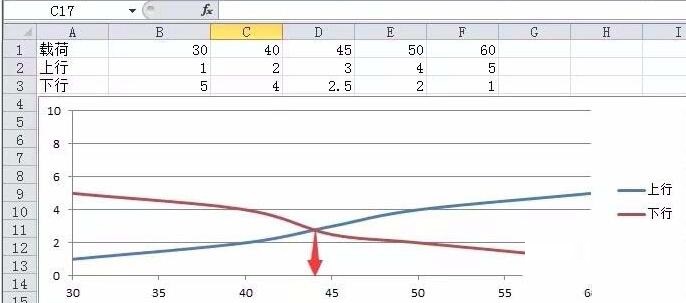
2. It can be seen intuitively from the figure that the intersection point is between the loads (40-50) - the yellow area in the above figure. Keep the data in the yellow area in the red box and delete the others. This step is to lock a relatively small area. range to reduce the difficulty of solving; the deleted graph is as follows:

3. Add the fitting curve (actually it is also solved using higher-order equations based on the principle of point fitting). The adding method is as shown in the figure:
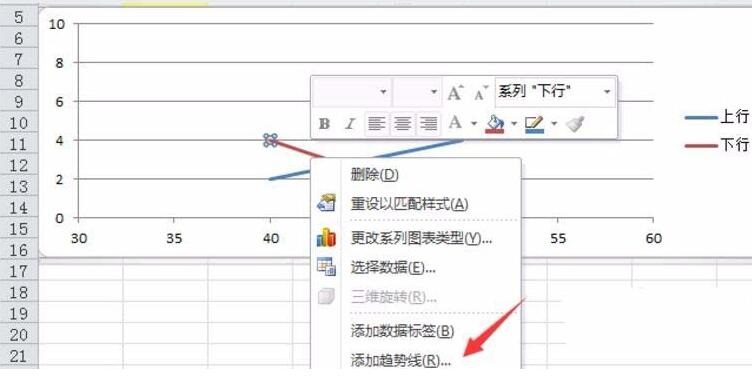
4. Add a trend line, select a polynomial, and display the formula. The purpose is to use the polynomial to fit the original curve.
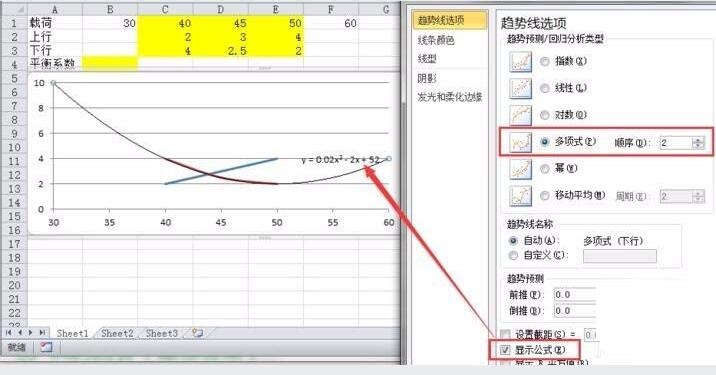
5. In the same way, add the polynomial trend to another line and display the formula
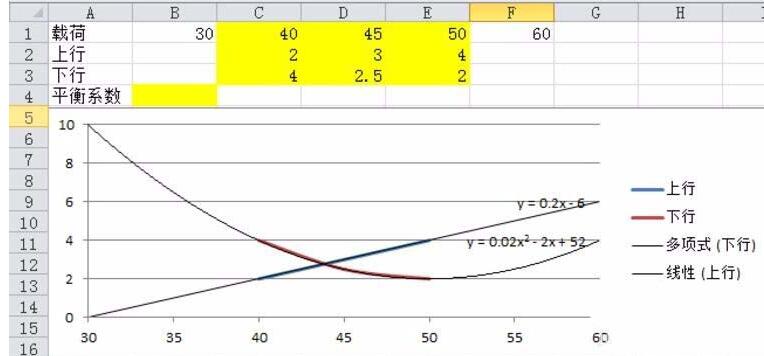
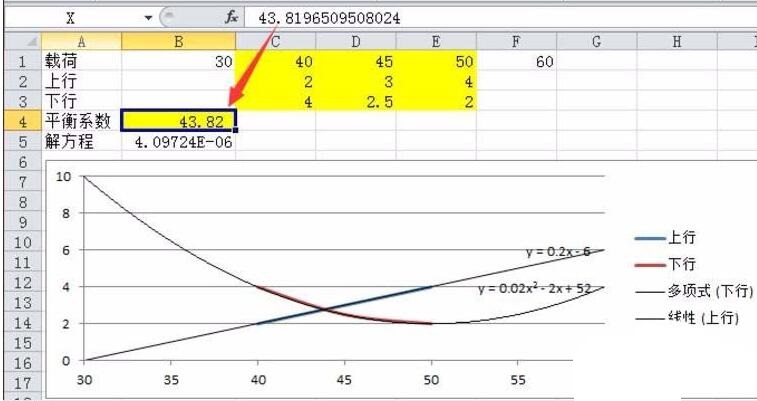
6. At this time, a system of equations can be obtained: y = 0.2x - 6...(1)y = 0.02x^2 - 2x + 52...(2) Use excel to solve the system of equations (1)(2), The intersection position of the fitting curve can be calculated, which is the "balance coefficient".
2. Solving a system of equations in Excel
1. System of equations (1)(2), organized into equations: 0.02x2 - 2.2x + 58 = 0
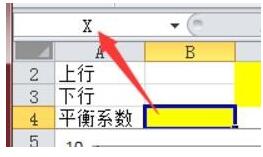
2. Select cell B4, enter X in the name box (note the "name box" in the upper left corner), as shown in the figure:
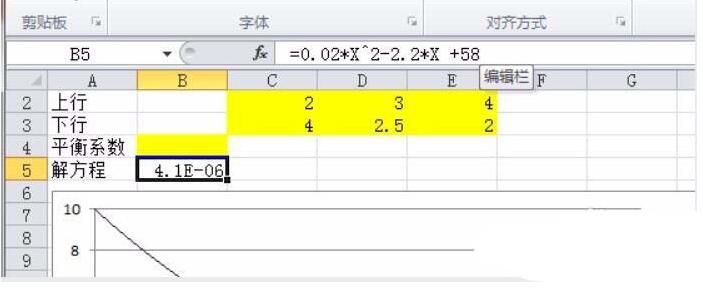
3. Enter the formula =0.02*X^2-2.2*X +58 in cell B5
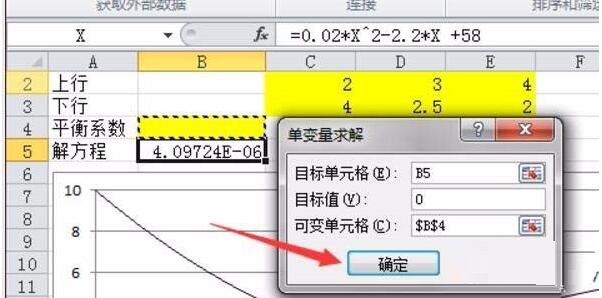
4. Solve
Target cell: B5
Target value: 0
Variable cell: B4
Click "OK" and find the balance coefficient to be 43.82

Above, I have shared with you the detailed steps for calculating the coordinates of intersection points of scatter plot curves in Excel. Friends in need should hurry up and read this article.


