WPS2019 is a modern office suite launched by Kingsoft Office, which provides three core functions of text, form and presentation that are deeply compatible with Microsoft Office. This version adopts a new flat design interface, supports smooth reading and writing of documents in docx, xlsx, pptx and other formats, and has built-in features such as PDF editing and conversion, massive online templates, and cloud storage collaboration, enabling real-time synchronization across multiple terminals. The personal version is free to use, and the enterprise version provides professional office solutions, fully covering Windows, macOS, Linux and mobile platforms, making it an efficient and convenient office choice. Next, let the editor of Huajun explain to you how to insert a bar chart in wps2019 and how to insert a bar chart in wps2019!
first step
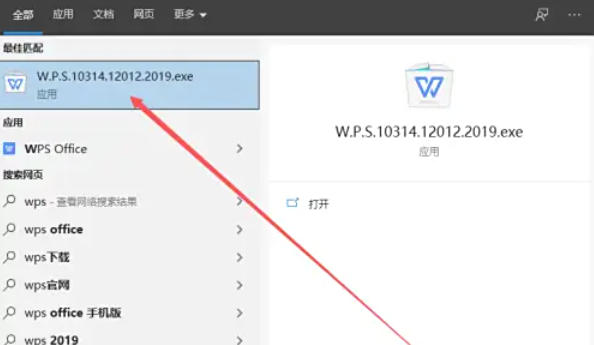
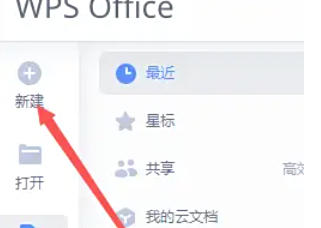
Start WPS 2019 → click "New" → select "Blank Document" (or open an existing document).
Step 2
Move the cursor to the paragraph where you want to insert the bar chart.
Step 3
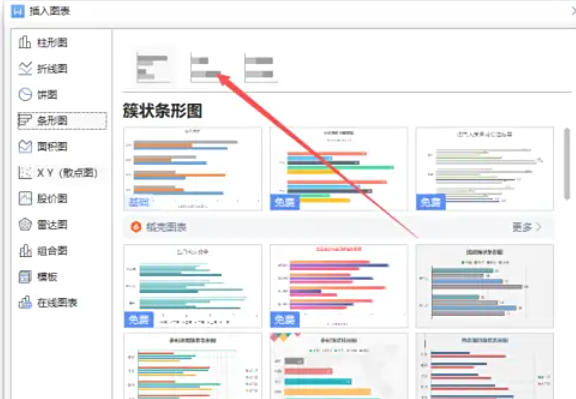
Click "Insert" on the menu bar → select "Chart" (the icon is a bar chart style). In the pop-up "Insert Chart" window, select "Bar Chart" on the left, and the default style (such as clustered bar chart, stacked bar chart, etc.) will be displayed in the preview area on the right.

Step 4
Choose a subtype based on your needs:
Clustered bar chart: Compare different categories of data (such as sales of each product).
Stacked bar chart: Displays the proportion of data (such as the proportion of expenses in each quarter).
Click "OK", the system will automatically insert a blank chart frame, and the "WPS Table" data editing window will pop up.

Step 5
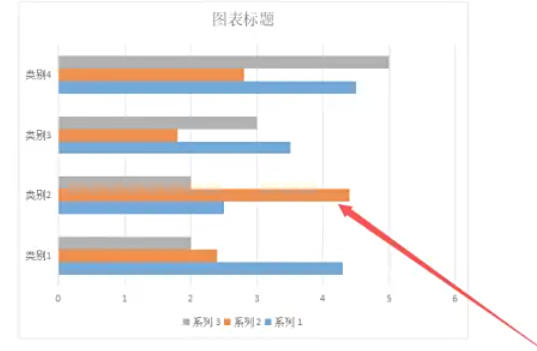
In the data editing window, enter the category name (such as "Product A" and "Product B") and corresponding values in table form. After closing the window, the bar chart is automatically generated based on the data.
Step 6
Right-click the bar chart → select "Format Chart Area" to adjust:
Color: Modify the bar fill color or border color.
Label: Add data label (right-click on the bar → select "Add Data Label").
Coordinate axis: Adjust the horizontal axis/vertical axis title and scale range.
The above is the editor of Huajun who has compiled for you how to insert bar charts in wps2019 and the methods of inserting bar charts in wps2019. I hope it can help you!


