Steps to make smooth line chart in PPT
Time: 2020-08-11Source: Huajun Software TutorialAuthor: Ai Xiaomo
Want to know how to make a line chart smooth in PPT? Below are the steps for smoothing the line chart in PPT compiled by the editor. Come and take a look, I hope it can help you!
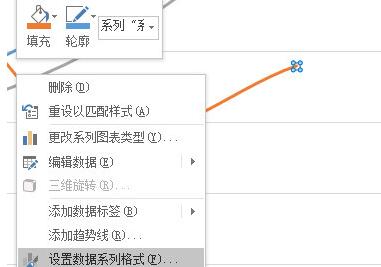
Insert a line chart, select the line inside, right-click and select [Format Data Series] from the menu.

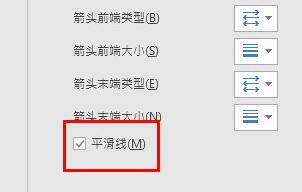
Select [Fill]-[Line] in the menu on the right, and check [Smooth Line] in the west.

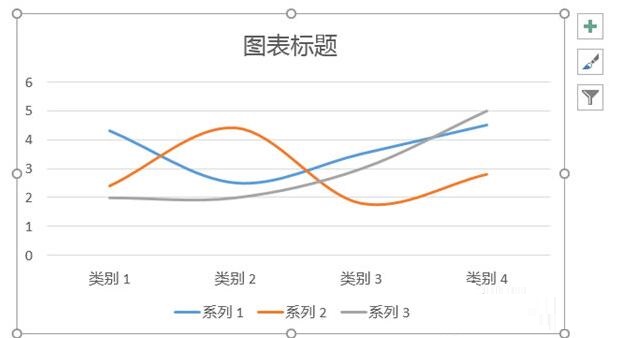
Then do this for each line, and your line statistical chart will be a beautiful smooth line.

Above, I have shared with you the steps to make a line chart smooth using PPT. Friends in need should hurry up and read this article.
Popular recommendations
-
Magical OCR text recognition software
Version: 3.0.0.327Size: 3.04MB
Magic OCR text recognition software is a professional, easy-to-use and efficient OCR tool, specially designed for Windows systems. Its core function is to convert pictures and scanned documents...
-
Quick OCR text recognition
Version: 7.5.8.3Size: 2.51MB
Jisu OCR text recognition software is a domestic shared tool designed for Windows systems. It is designed to convert text in pictures, scanned documents, PDF and other files...
-
OCR text recognition software
Version: 4.0Size: 30.09MB
OCR text recognition software uses optical character recognition technology to convert text in unstructured documents such as pictures, scans, and PDFs into editable electronic text...
-
Hero Excel set wizard
Version: 1.006Size: 5MB
Hero Excel Template Wizard is a truly usable template printing software that can fill templates with Excel data and perform batch printing. Can be customized...
-
Extreme Office Government Edition
Version: v3.0.0.2Size: 159.69 MB
The official version of Speed Office Government Edition is an office software tailor-made by Haiteng Company for government services. The latest version of Speed Office Government Edition can be more...


