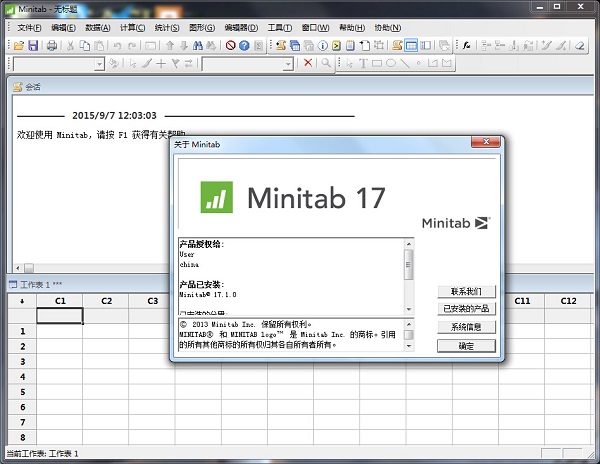
Minitab Chinese version software features
1. This version expands the scope of the assistance menu: DOE and multiple regression. Provide support for graphical analysis by improving the operation interface and adding comprehensive reports;
2. At the same time, the assistance menu also enhances the existing statistical functions in minitab16: including measurement system analysis, capability analysis, hypothesis testing and control charts.
3. In addition, minitab17 has recently launched a Portuguese version. Every part of the software has been translated, from statistics to the interface and all help content.
Minitab Chinese version configuration requirements
Operating system: 32-bit and 64-bit XP, Vista, Windows 7 or Windows 8 system
Memory: 512 MB (minimum); 1 GB or more (recommended)
Cpu: Pentium-compatible processor with 1GHz or higher configuration
Hard disk space: 140MB for multi-user; 160MB for single user; 55MB for language pack
Screen resolution: 1024 x 768 or higher
AdobeReader: Used to read Get Started For Minitab, version 5.0 or higher is required.
Minitab Chinese mode setting tutorial
How to set minitab to Chinese?
1. After opening, please select the [Chinese] option and check it according to the prompts in the picture.
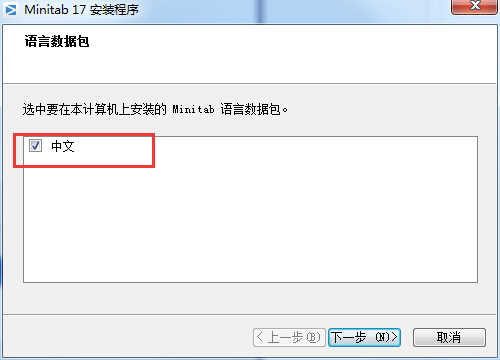
2. Finally, the Chinese version of minitab is set up successfully. Please run and open the minitab software to check.
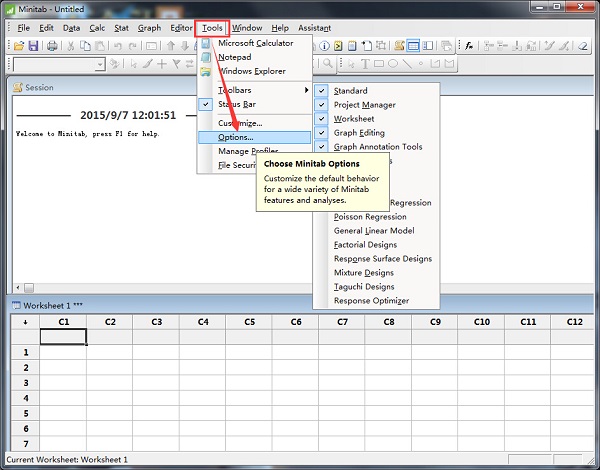
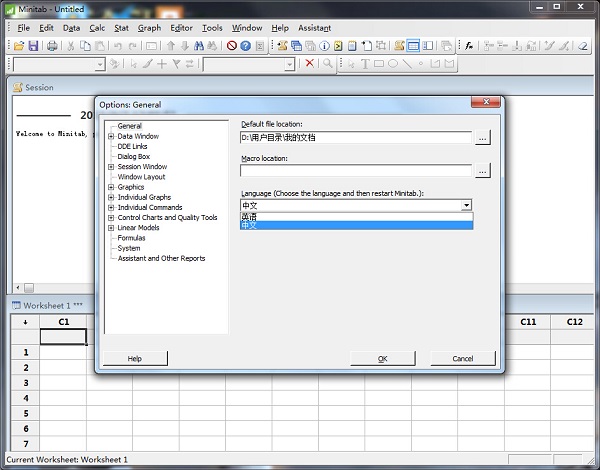
3. If the Chinese mode is not displayed normally, please select [Tool]-[Option]-[General] in the menu bar to select the option to set the Chinese mode and restart the minitab software.
Minitab Chinese version FAQ
How to generate control charts in minitab?
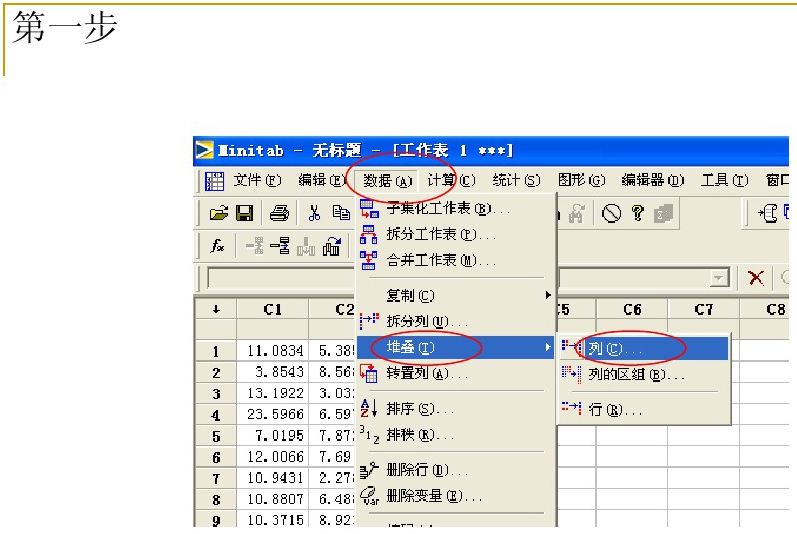
1. First, you need to run and open minitab, and then select and enter two columns of data according to the prompts in the picture. [Data]——[Stack]——[Column]
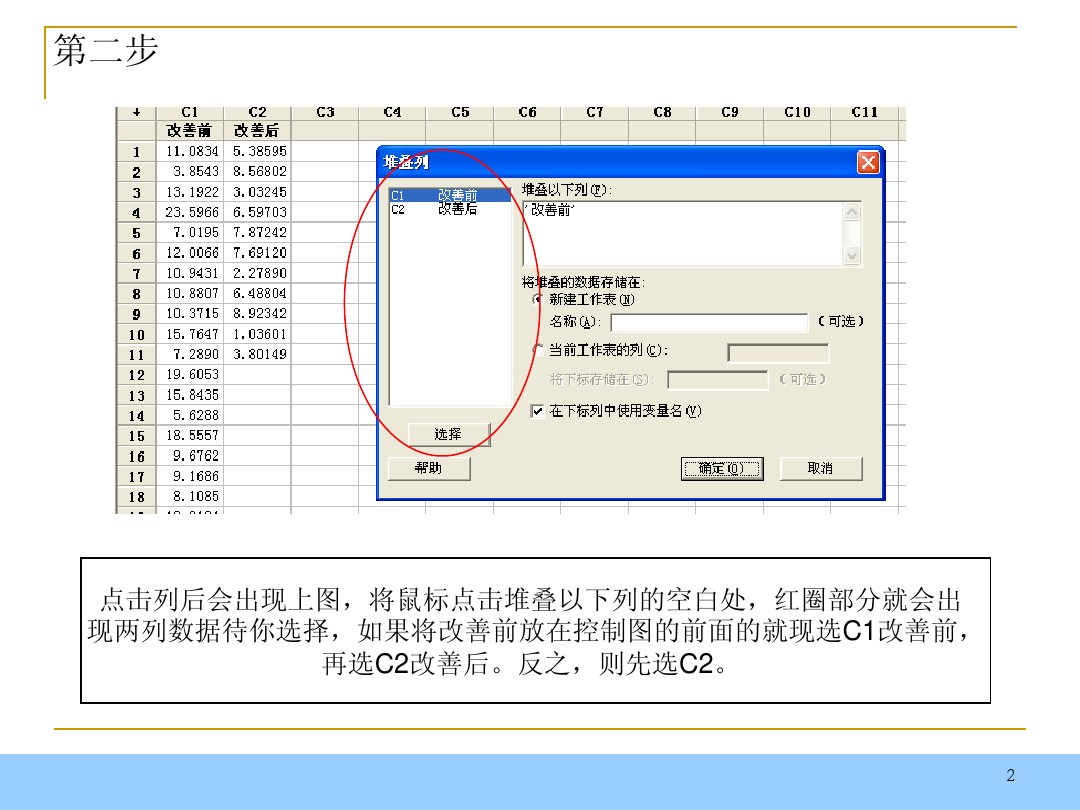
2. After entering the minitab stacked column interface, you can select the column that needs to be prioritized according to the operation prompts, before or after improvement.
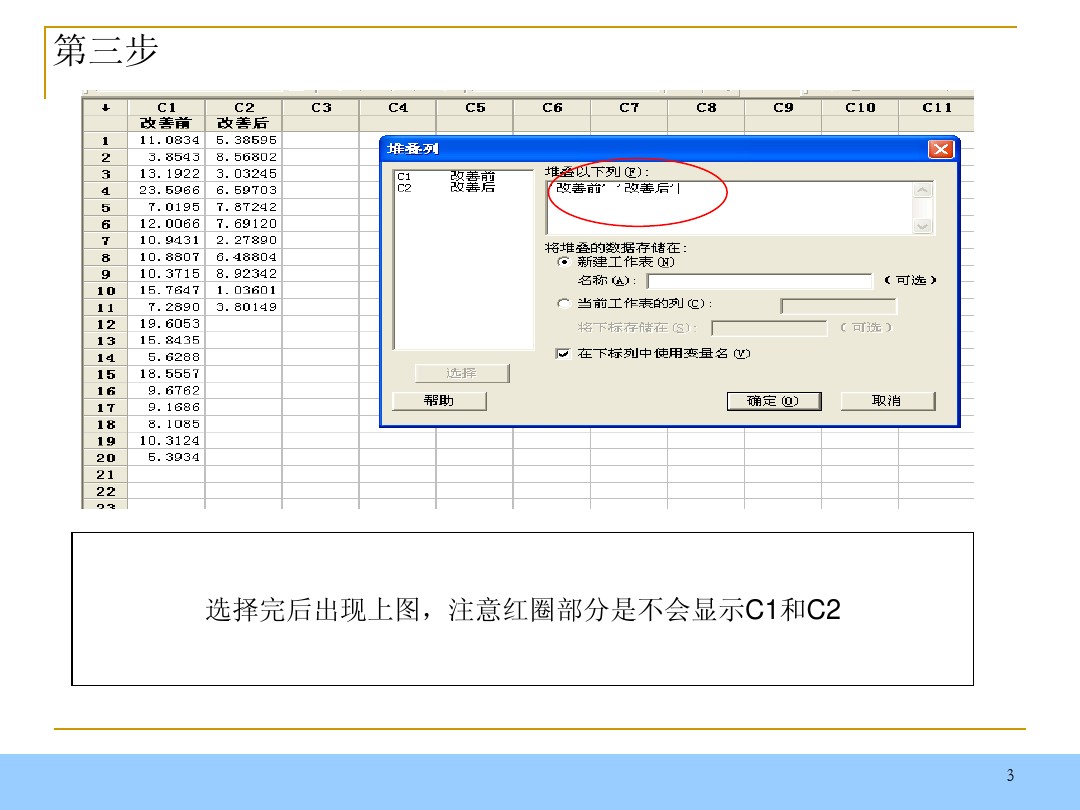
3. Screenshot of the effect display after setting up the stacked columns:
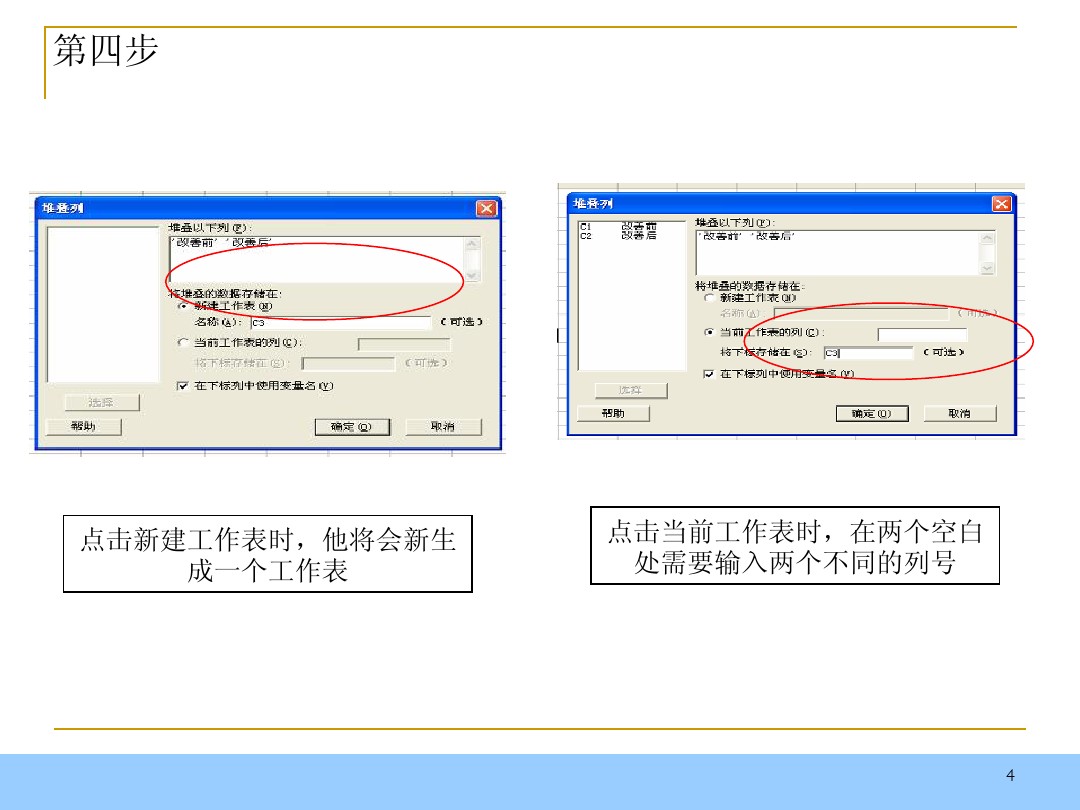
4. Please select a new worksheet according to the prompts in the picture and select [New Worksheet].
5. After creating the new minitab worksheet, select [Control Chart] - [Single Value Variable Control Chart] - [Single Value]
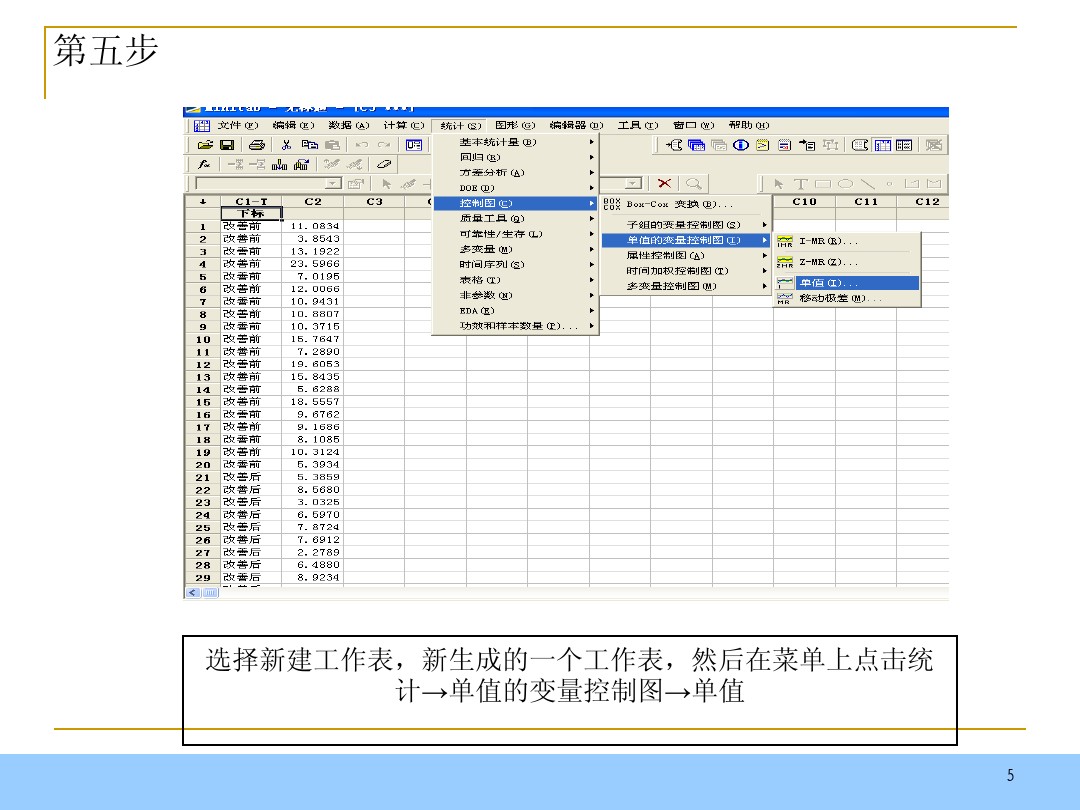
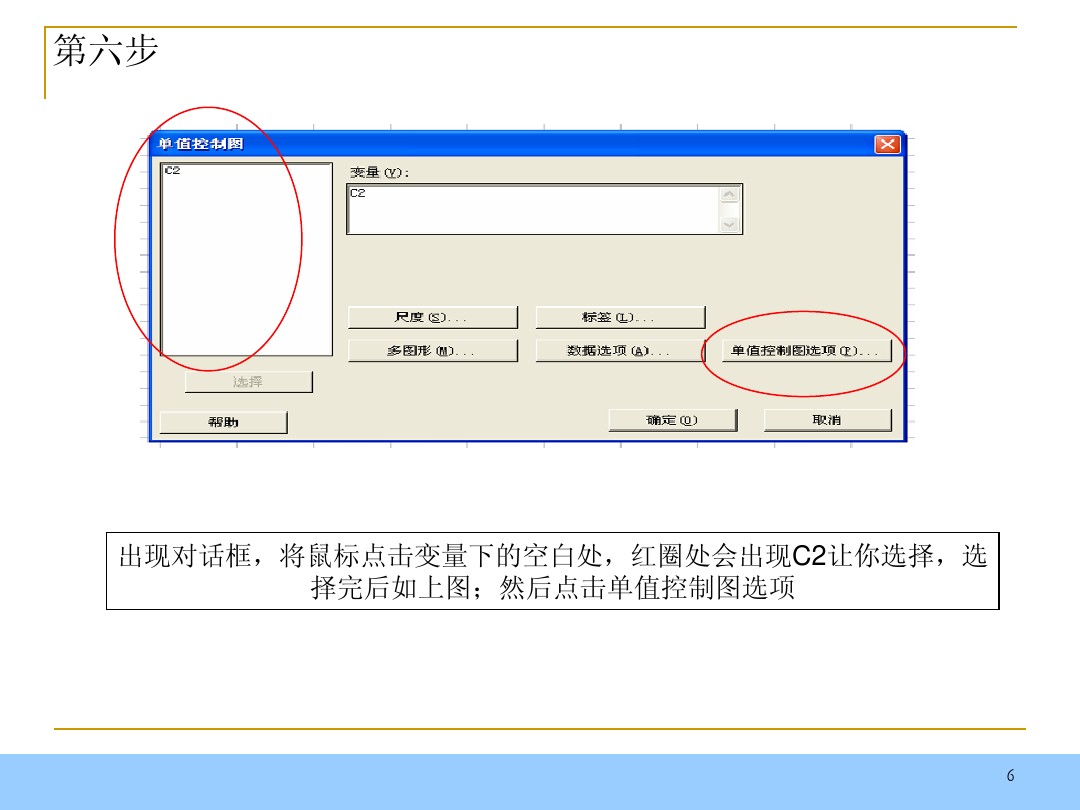
6. After entering the minitab single value setting interface, select [C2] and then set the [single value control chart option]
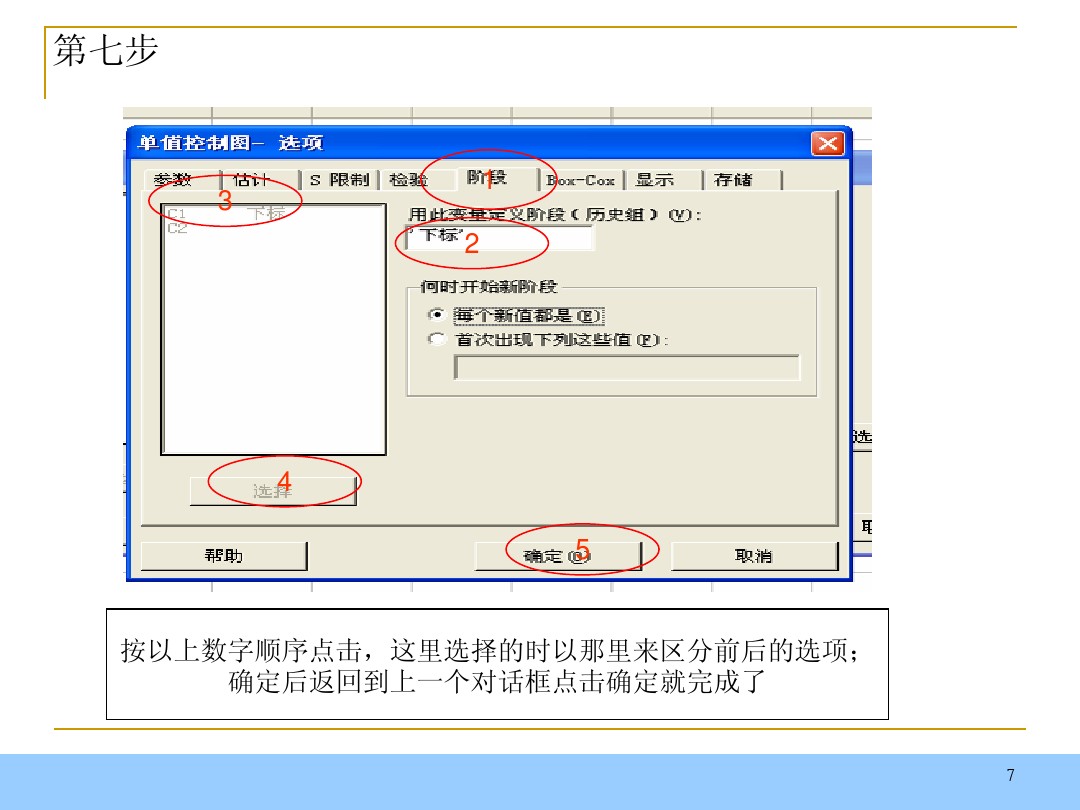
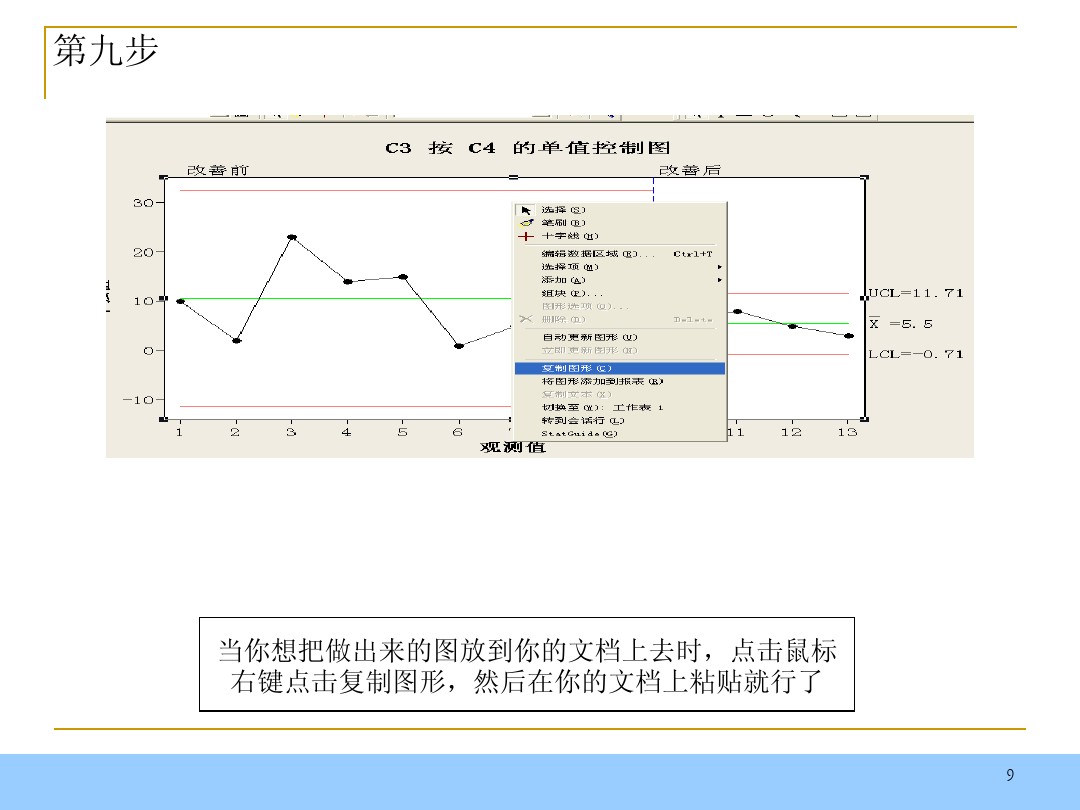
7. Then you need to select and set according to the order in the picture. Operation【stage]——[Use this variable to define the stage]——[Blank space in Figure 3]——[Select]——[Confirm]
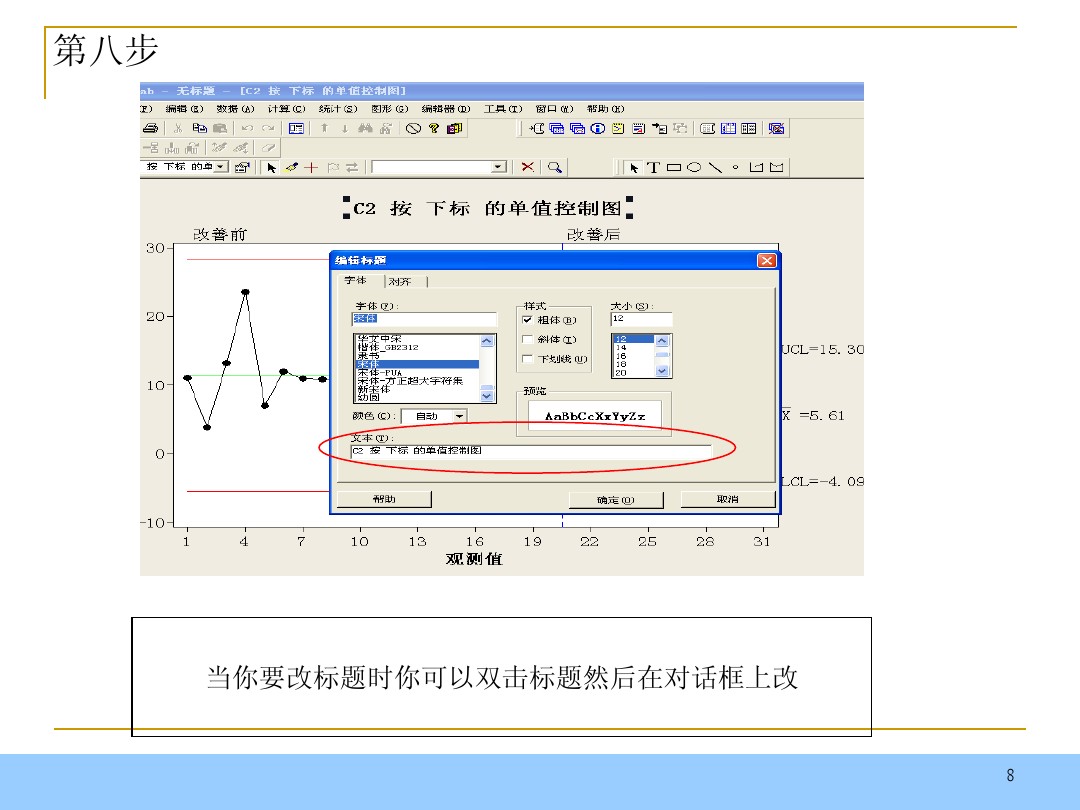
8. If you need to change the title, please double-click the title to set the style you want in the pop-up interface.
9. We can also copy the prepared picture to the document and then paste it.
How does minitab generate data?
1. First, you need to run and open minitab, as follows: double-click the icon to run and open.
2. Select [Cale] in the opened minitab menu bar
3. Enter the Cale drop-down and select [Random Data] - [Normal...]
4. Please enter the corresponding information in the pop-up window according to the prompts.
1): Please enter the number of data to be generated;
2): Please enter the number of Minitab columns to be saved;
3): Please enter the average value of the data to be generated;
4): Please enter the standard deviation value of the data to be generated;
Finally, select [ok] to complete.
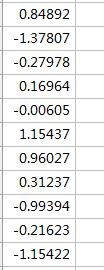
5. Detailed explanation of the information in the experimental data screenshot: The editor chose to generate 32 data, there is column C1, the average value of the data is 0, and the standard deviation range is controlled at 1.
6. After the final confirmation, a lot of data appears. The effect is as follows:

What should I pay attention to when installing Minitab?
Before installing Minitab, it is recommended to turn off anti-virus software to avoid the installer being falsely reported as a virus.
You will be prompted for a product key during installation, which will be emailed to the user after purchase.
Please complete the download and installation within 30 days of purchase, otherwise you may need to contact Minitab Support for assistance.
matlabDifference from Minitab
Matlab and minitab have different focuses.
MATLAB is a commercial mathematics tool produced by an American company. Friends can use this tool to visualize data, and can also use this tool to do advanced technical computing languages such as algorithm development, data analysis, and numerical calculations.
Minitab is a professional statistical software, but it is not as famous as SAS and SPSS. Of course, MATLAB also has a statistical analysis module. In short, MATLAB is more widely used.
Okay, the above is the difference between the two that the editor has explained to you. I believe you all understand it. If anyone needs MATLAB, you can get the link address here:softwaredownload4.com/soft/34887.htm
Minitab Chinese version update log
- Automatic model selection to quickly identify important variables
- More graphical visualization exploration results
- Response Optimizer to find optimal settings
|
Huajun editor recommends: If you want to improve the work efficiency and work quality of an organization or enterprise by analyzing data, the editor recommends you to use this minitab statistical tool. This statistical tool can help companies or institutions capture trends by analyzing various data information, and can also solve certain problems through the results of big data. In addition, the editor of Huajun has also collected and compiled other [data analysis] tools for you to choose and download, such as: general database query analyzer, data analysis and processing system DOMAS, etc. |


Useful
Useful
Useful