- Green versionView
- Green versionView
- Green versionView
- Green versionView

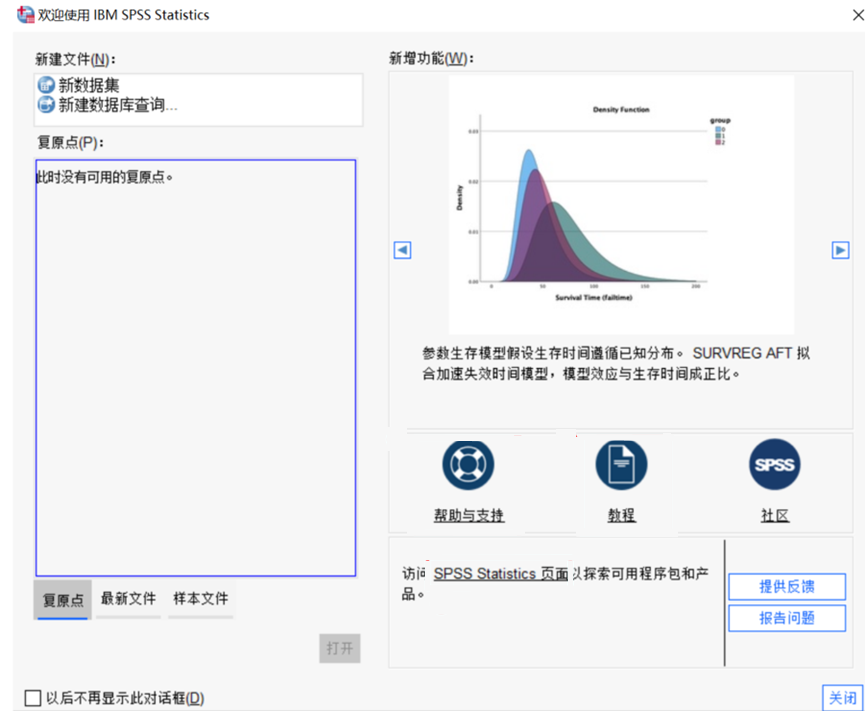
SPSS software features
1. Powerful computing functions
Users only need to understand the principles of statistical analysis and do not need to be familiar with various algorithms of statistical methods. spss can give you the statistical results you need.
2. Powerful data analysis function
“ spss comes with hundreds of functions, providing users with complete data analysis functions, from simple statistical description to complex multi-factor statistical analysis methods.
3. Compatible with multi-format data interface
spss is compatible with outputting files in a variety of formats, making it easy to read data from other databases.

SPSS software features
Data management
Data entry and editing: Supports keyboard input, copy and paste, and external data import (such as Excel, CSV).
Data cleaning: identify and handle missing values and outliers, support data type conversion and variable recoding.
Data merging and splitting: vertical merging (same variable columns) or horizontal merging (different variable columns), splitting data sets according to conditions.
Statistical analysis
Descriptive statistics: frequency distribution, mean, standard deviation, analysis of variance, etc.
Inferential statistics: t-test, chi-square test, non-parametric test, etc.
Advanced analysis: regression analysis (linear, logistic regression), cluster analysis, factor analysis, principal component analysis, etc.
Chart generation
Supports various chart types such as bar charts, line charts, pie charts, scatter plots, box plots, etc.
Provides chart customization options, such as color, label, axis adjustment, etc.
Result output
The results are saved in .spv format and can be copied to Word or other documents.
Provide detailed statistical reports, including hypothesis testing results, model summaries, and more.
SPSS FAQ
How to perform homogeneity of variance test in SPSS? What is its command?Analysis of Variance (ANOVA) requires that the variances of each group are uniform, but it is generally believed that if the number of people in each group is similar, even if the variance test fails, it will not be a big problem.
In the One-Way ANOVA dialog box, click the Options... button and check Homogeneity-of-variance. It will generate Levene, Cochran C, Bartlett-Box F and other test values and their significance level P value. If the P value is <0.05, the hypothesis of neat variance is rejected.
By the way, the Cochran and Bartlett test is quite sensitive to non-normality. If the test result of "rejection of neat variance" occurs, it may be made for this reason.
How to convert SPSS result files (*.spo files) to other formats?
The result file of SPSS has been a special *.spo file since version 7.0. As far as I know, there is no word processing software that can read it, but SPSS provides the function of transferring the file to other formats. Select the File menu->export in the OUTPUT window of SPSS to save the result file as an HTML file and a TXT file. Of course, it is much uglier than the spo file. Charts are automatically converted into JPG images and cannot be edited. Therefore, it is better to export after all modifications are completed. In addition, this command can also be performed on a single picture or table. Select the desired picture or table, right-click, and select EXPORT in the shortcut menu.
I want to paste the SPSS result table directly into WORD for use. How can I keep the original format and paste it?
Select the desired table, right-click, and select copy object in the shortcut menu. At this time, the pasted table will maintain its original format (actually what is pasted is a picture).
R language vs. SPSS?
Both spss and R language are good statistical analysis software. The operation interface and result interface are both in Chinese language, so there is no need to worry about usage problems.
Compared with R language, spss is simpler to operate and easier to get started. It does not require a strong programming foundation. As long as you have a simple understanding of Windows operations, you can get started easily. Of course, for those who like programming, you can also choose to use programming statements. It can be said that whether you are a professional or a non-professional, you can easily control spss. But one thing is that it is not open source software, and it takes up slightly more memory than R.
R language is a very professional statistical analysis software with more comprehensive functions. R language is more suitable for professionals to use. It is more complicated than spss and requires a certain programming foundation. To use it, you need to write code statements. Of course, because it is implemented in code, it is more flexible in use.
Huajun editor recommends:
As a widely used and powerful statistical analysis software, SPSS is more professional than Excel statistics and is very simple to operate. The editor strongly recommends that you download and use it. In addition, there areSQL Server automatic installer,Data Loader,access tools,DBF Commander,DBeaverIt is recommended for everyone to download and use.


Useful
Useful
Useful