If you are looking for software to use, go to Huajun Software Park! software release AI product list

Hello, if there is a need for software inclusion, please package the software and attach the software name, software introduction, software-related screenshots, software icon, soft copy, business license (if you do not have a business license, please provide the front and back of the corresponding developer ID card and a photo of yourself holding the ID card), and send it to email http://softwaredownload4.com/sbdm/user/login

Close >>

Send to email:news@onlinedown.net

Close >>

Location: Home pagePC softwareProgramming softwareProgramming controls Contour drawing control (Contour45.ocx)
Contour drawing control (Contour45.ocx)

Contour drawing control (Contour45.ocx) 4.5

QR code
  • Software licensing: free software
  • Software size: 0.07MB
  • Software rating:
  • Software type: Domestic software
  • Update time: 2024-12-26
  • Application platform: Winxp/vista/win7/win8/2000/2003
  • Software language: Simplified Chinese
  • Edition: 4.5

Download the service agreement at the bottom of the page

Software introduction Related topics FAQ Download address

Basic introduction
Contour drawing control (Contour45.ocx) paragraph first LOGO
It is known that there are numRows times numCols regularized grids in the rectangular area, and the corresponding amplitude value on each grid is known to be z (xi, yi). Given numLayers height values ​​LayerValue (I) and each color representing the height LayerColor (I), solve the contour graphic. The calculation method can be briefly described as:

(1) Give the number of rows numRows and the number of columns numCols of the grid data matrix.

(2) Give the value zValue(i,j) of the grid data matrix, i=0, 1, …, numRows-1; j= 0, 1, …, numRows-1.

(3) Give the coordinates xValue(i), yValue(j) of the grid node.

(4) Give the number of height layers numLayers and the height value of each layer.

(5) Give the height layering value LayerValue(i) and its corresponding color LayerColor(i).

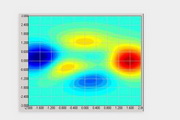
(6) Given coordinate display range: xAxisMin, xAxisMax; yAxisMin, yAxisMax; zAxisMin, zAxisMax.

(7) Use PlotContour() to generate contour graphics, and use the PlotPicture() method to generate graphics filled with contour colors.

http://www.chengbosoft.com ChengBo Software Workshop.

FAQ

Contour drawing control (Contour45.ocx)

Contour drawing control (Contour45.ocx) 4.5

Close