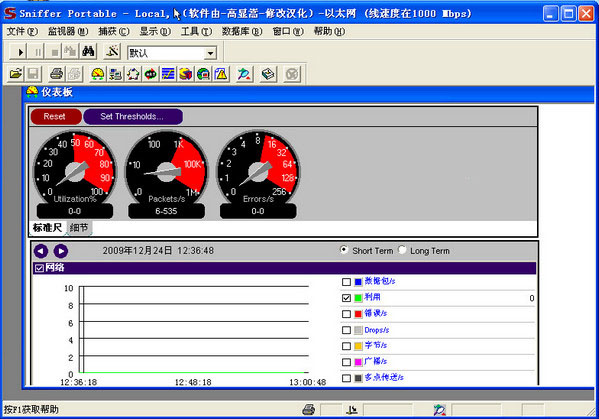
sniffer pro software features
Capture network traffic for detailed analysis
Use expert analysis systems to diagnose problems
Real-time monitoring of network activity
Collect network utilization, errors, etc.
Before performing traffic capture, first select the network adapter to determine which network adapter of the computer to receive data from.

sniffer pro software features
Can quickly set up the database
It also supports the setting of various practical functions
It can also quickly help users read and use
You can also view various performance
Sniffer pro installation method
1. Please install Sniffer Pro 4.70.530 original English software first
2. Exit the Sniffer Pro 4.70.530 application before localization
3. Run the patch program and select the installation directory of your Sniffer Pro 4.70.530 for localization. Video tutorial included in the compressed package

How to use sniffer pro
How to capture network data using Sniffer Pro?
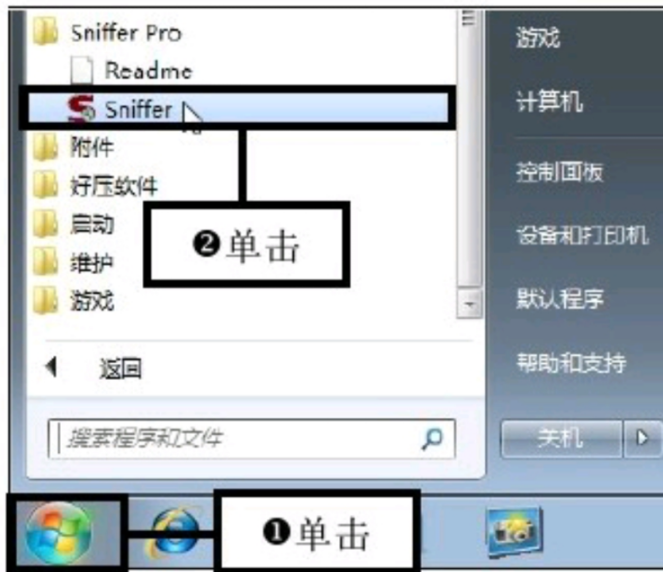
1. After successfully installing Sniffer Pro, click the "Start" button;
2. Click the "All Programs>Sniffer Pro>Sniffer" command in the pop-up "Start" menu to start the Sniffer Pro application.
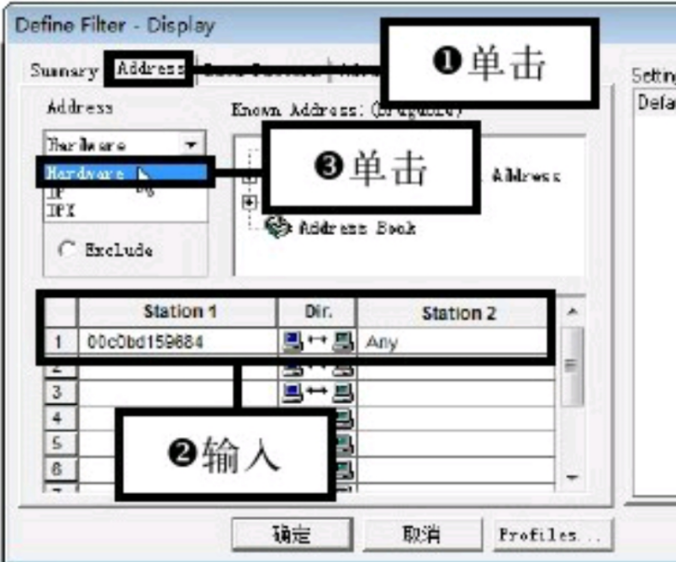
3. Click the Define Filter command: Open the Sniffer Pro main interface and click the "Display>Define Filter" command in the menu bar.

4. Set capture conditions: Pop up the Define Filter dialog box, switch to the Address tab,
5. Enter the capture address in the lists of Station1 and Station2. For example, enter 00c0bd159684 below Station1, and Station2 will automatically display any.
6. Then select the capture condition in the Address drop-down list, for example, select Hardware, which is the basic capture condition.
7. Edit protocol capture conditions:
(1) Switch to the Advanced tab,
(2) Select the protocol capture conditions in the list box, for example, check the "IP>ICMP" checkbox in turn, that is, ICMP is the protocol to be captured.
(3) Then click the "OK" button.

8. Start capturing:
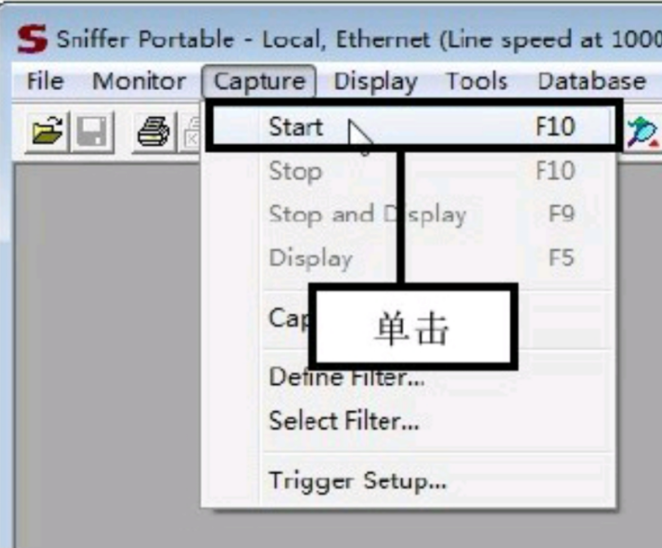
(1) Return to the main interface of Sniffer Pro, click the "Capture>Start" command in the menu bar to start capturing data packets in the LAN.
9. View and select the captured packet information:
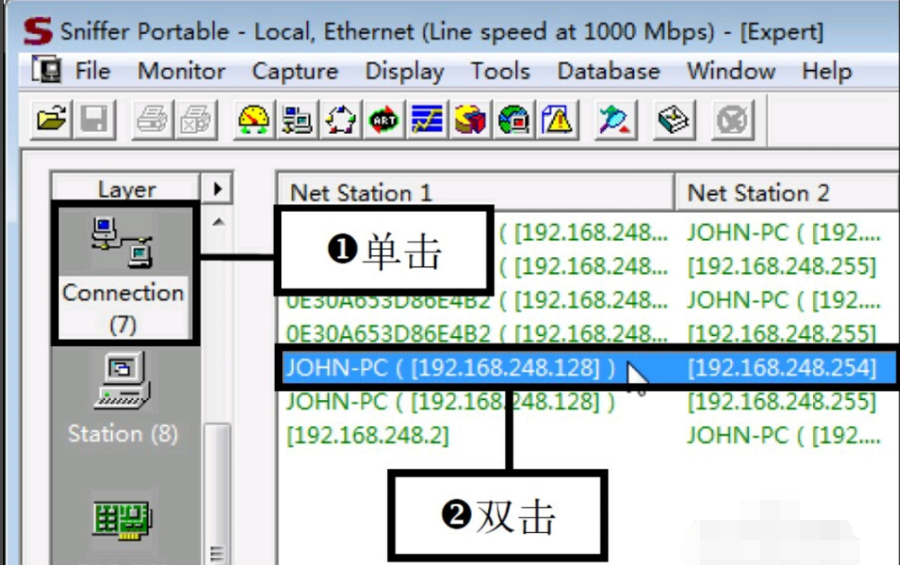
(1) Click the Connection option on the left side of the window. At this time, you can see the captured information packet and the computer address that sent and received the data packet in the window.
(2) Select any piece of captured packet information and double-click the corresponding option.
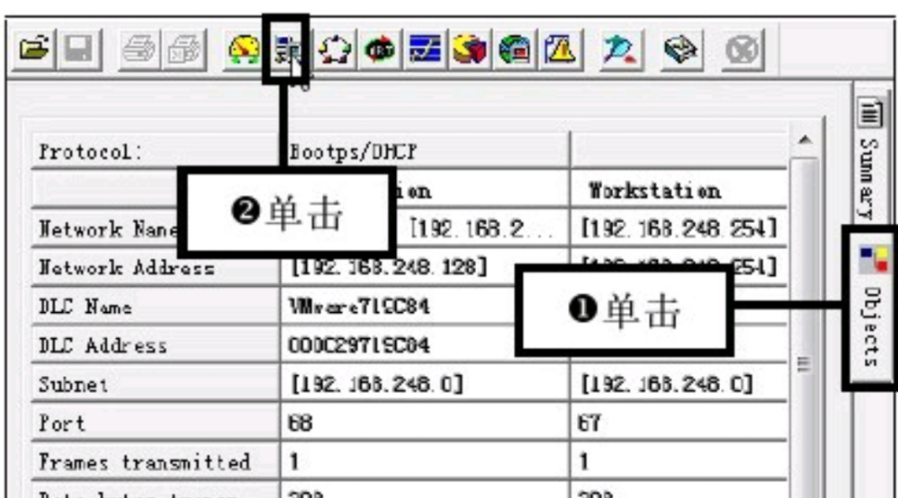
10. View the detailed information of the message: switch to the Objects tab, the detailed information of the message is displayed in this interface, click the [Host Table] button to view the message statistics.
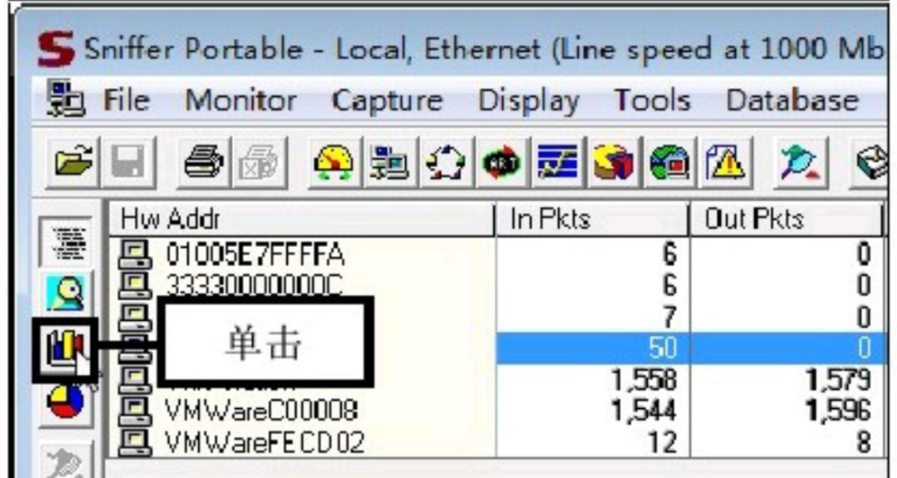
11. View the packet statistics: At this time, you can see the statistical information of the packet in the window. If you want to view the graphical statistics corresponding to the packet, click the column icon button on the left.
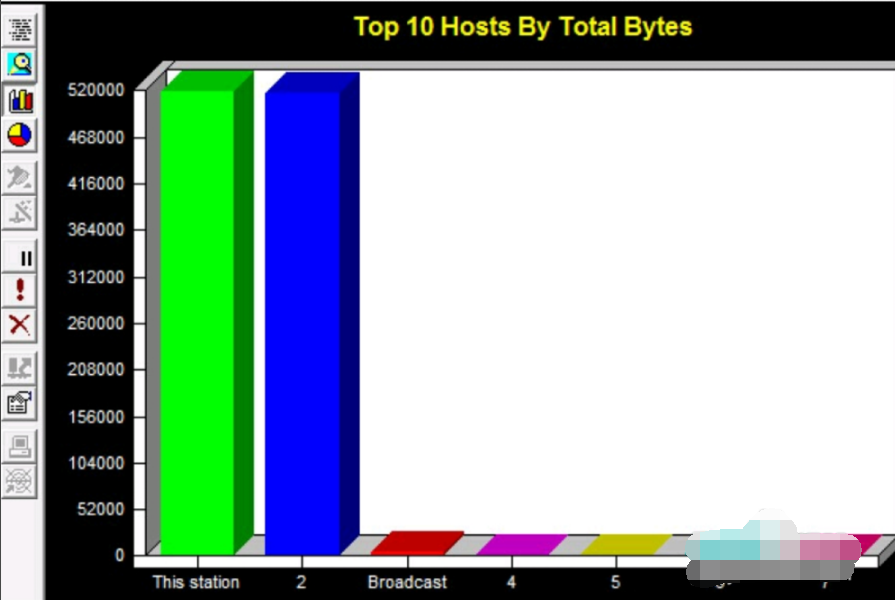
12. View the message column chart:
(1) At this time, the column chart of the message appears in the window. The ordinate is the data packet, and the abscissa is the capture address.
sniffer pro FAQ
1. How to import and export filter files of filters defined by snifferPro?
Method 1. Forced coverage method
(1) C:Program FilesNAISnifferNTProgram
(2) There are many directories starting with Local below, corresponding to each profile in select settings.
(3) Enter the corresponding local directory and use sniffer scan.csf to overwrite Sniffer.csf (capture filtering) or snifferdisplay.csf (display filtering)
Method 2: Make a sound in the east and attack in the west
(1) C:Program FilesNAISnifferNTProgram
(2) There is a file Nxsample.csf below, backup it.
(3) Replace nxsample.csf with Sniffer scan.csf
(4) Start Sniffer
(5) Create a new filter
(6) Select the corresponding filter in the sample selection in the new filter dialog box,
(7) Create a new filter.
(8) Repeatedly create new ones until all are added
2. What are sniffer’s alert logs used for?
The sniffer alarm log is also part of the sniffer expert system. Usually abnormal TCP/IP communication will generate alarms and logs.
For example: the response time of ping is too long, too many packets are lost or retransmitted in a certain session, too many broadcasts/multicasts are generated per unit time, etc.
3. What’s wrong with the unrealistic dashboard and alarm log of sniffer pro4.75?
Please check whether your operating system has java installed~
Comparison of similar software with sniffer pro
Ethereal is a free network protocol detection program that supports Unix and Windows. It allows you to capture relevant information of the running website through the program, including the flow direction of each packet and its content. The information can be seen according to the operating system language, making it easy to view and monitor TCP session dynamics, etc.
CommView for WiFi For network administrators, "CommView" can be used to observe network connections, statistical analysis of important IP data, such as TCP, UDP, and ICMP, and can display important information such as internal and external IP addresses, Port locations, host names, etc., and the obtained data can be stored in the hard disk for review.
Wireshark can be described as an evergreen tree in the network analysis profession. Any responsible network analyst has a soft spot for this software. Use this software to capture packets and then display them in a way that makes it easy for administrators to track conversations and data flows between computers.
The above softwares each have their own characteristics, and users can choose the appropriate software to download and use according to their own needs.
sniffer pro update log
1. Fixed several bugs;
2. Optimize details;
Huajun editor recommends:
The sniffer pro software is a software with excellent performance, which is obvious to all. Huajun Software Park also hasAdobe SVG Viewer,General tax data collection software,Web Copy Master,E-ruler,Youya interactive movie clientWaiting for related software worth downloading and using, come and choose your favorite one!





Your comment needs to be reviewed before it can be displayed