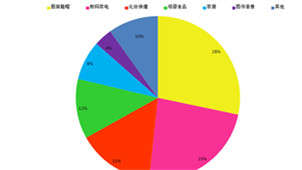
Statistical chart software collection This is a special topic on statistical chart software. Statistical charts are various graphics drawn based on statistical figures using geometric figures, images of things, maps, etc. It has the characteristics of intuitive, vivid, concrete and so on. Statistical charts can simplify, popularize, and visualize complex statistical figures, making them clear at a glance and easy to understand and compare. Therefore, statistical charts play an important role in the collection and analysis of statistical data and are widely used. When answering questions about statistical graphs in the data analysis test, you must not only examine the intuitive image of the graph, but also pay attention to checking the data, and do not be fooled by the superficial image. Click to view PC software wfChart statistical chart component 2024-12-23 Office software | 4.1MB | 5.6 View China Picture Size Statistics Tool 2024-12-23 Image management | 0.14MB | 1.9 View Related articles How to check the card drawing statistics in Collapsed Star Dome Railway? -Look at the draw card statistics of the Collapsed Star Dome Railway How to check the card drawing statistics in Collapsed Star Dome Railway? -Look at the draw card statistics of the Collapsed Star Dome Railway How to perform descriptive statistics in SPSS-How to perform descriptive statistics in SPSS WPS word count statistics function How to view various statistical information in Zoom - How to view various statistical information in Zoom How to check statistics in Forza Horizon 5 - How to check statistics Related topics Kingsoft wps special topic wps official website Vipshop software encyclopedia Excel English-Chinese translation Looking forward to it