How to Create a Sparkline Chart in Microsoft Excel 2019 - Methods to Create a Sparkline Chart
Time: 2022-03-06Source: Huajun Software TutorialAuthor: monster
Many people don’t know how to create a mini line chart in Microsoft Excel 2019? The article brought to you today is Microsoft Excel
If you still don’t know how to create a mini line chart in 2019, let’s learn it with the editor.
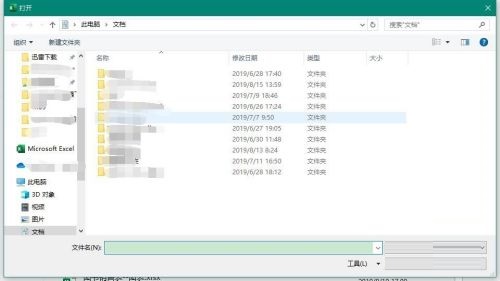
Step 1: Open the Excel 2019 document and create a new document (as shown in the picture).

Step 2: Open the worksheet where you need to create a mini table (as shown in the picture).

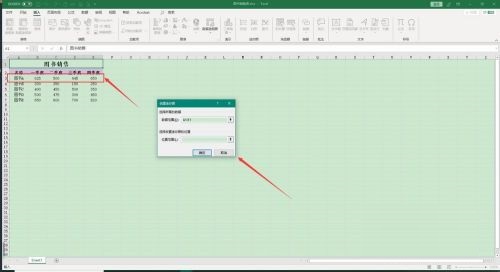
Step 3: Click the "Insert" button in the menu bar (as shown in the picture).

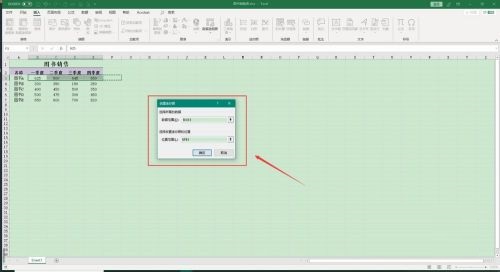
Step 4: Click "Line Chart" in the "Sparkline" area, select the corresponding cell data area and the location to insert the sparkline in the pop-up dialog box (as shown in the figure).


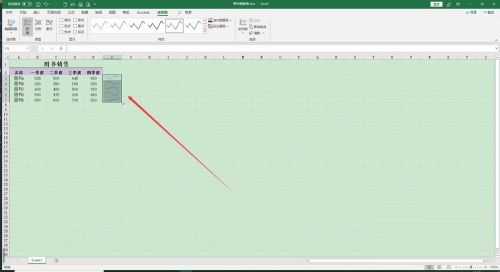
Step 5: Finally, the mini line chart is successfully inserted (as shown in the picture).

The above is the entire content of how to create a mini line chart in Microsoft Excel 2019 brought to you by the editor. I hope it can help you.
Popular recommendations
-
Quick OCR text recognition
Version: 7.5.8.3Size: 2.51MB
Jisu OCR text recognition software is a domestic shared tool designed for Windows systems. It is designed to convert text in pictures, scanned documents, PDF and other files...
-
OCR text recognition software
Version: 4.0Size: 30.09MB
OCR text recognition software uses optical character recognition technology to convert text in unstructured documents such as pictures, scans, and PDFs into editable electronic text...
-
Hero Excel set wizard
Version: 1.006Size: 5MB
Hero Excel Template Wizard is a truly usable template printing software that can fill templates with Excel data and perform batch printing. Can be customized...
-
Extreme Office Government Edition
Version: v3.0.0.2Size: 159.69 MB
The official version of Speed Office Government Edition is an office software tailor-made by Haiteng Company for government services. The latest version of Speed Office Government Edition can be more...
-
Government WeChat
Version: 3.1.300.209Size: 498.52MB
The latest version of Government WeChat is a very professional mobile office software. The official version of Government WeChat has powerful and practical functions and can support internal mobile office and instant communication...


